
Figure 2.
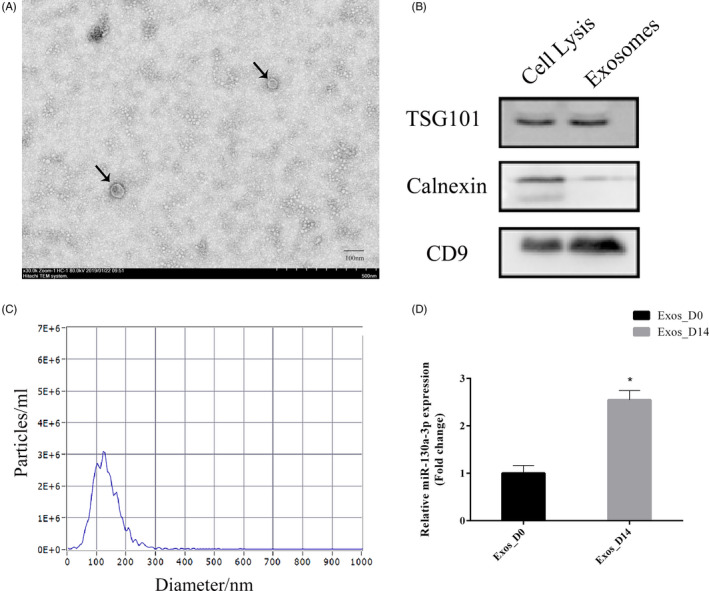
Identification of exosomes derived from ADSCs and the expression of miR‐130a‐3p in ADSCs‐derived exosomes. A, The size and morphology of exosomes observed using TEM. Scale bar: 100 nm. B, Specific markers of exosomes detected by Western blot. C, Nanoparticle tracking analysis of exosomes. D, qPCR analyses expression of miR‐130a‐3p in Exos_D0 and Exos_D14. *represents significant differences between Exos_D0 and Exos_D14. *P < .05