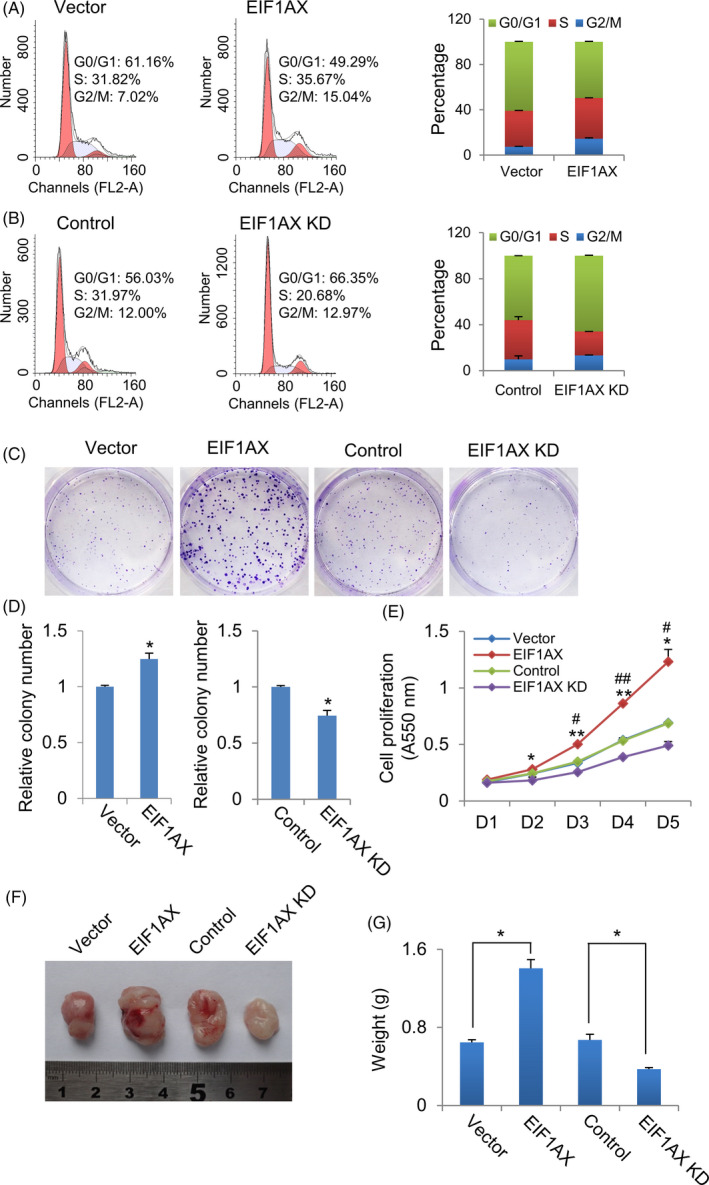
Figure 2.

EIF1AX promotes breast cancer cell proliferation and tumorigenesis. A, The effect of EIF1AX overexpression on cell cycle progression. Cell cycle analysis of control and EIF1AX overexpressed MCF‐7 cells by flow cytometry. The right panel data are presented as the mean ± SD from three independent experiments. The left panel shows representative results. B, The effect of EIF1AX knock‐down on cell cycle progression. Cell cycle analysis of control and EIF1AX knock‐down MCF‐7 cells using flow cytometry. The right panel data are presented as the mean ± SD from three independent experiments. Representative results are shown in the left panel. C and D, Colony formation assay. Represent images of EIF1AX overexpressed and knock‐down MCF‐7 cell colonies (C). Statistics of the colony number of each group (D). Data are presented as the mean ± SD from triplicate experiments. *P < .05, Student's t test. E, The effect of EIF1AX on cell proliferation. Cell proliferation analysis of EIF1AX overexpressed and knock‐down MCF‐7 cells. Data are expressed as the mean ± SD from triplicate experiments. *P < .05; **P < .01, compared with empty vector. # P < .05; ## P < .01, compared with control siRNA, Student's t test. F and G, EIF1AX promotes breast tumorigenesis. Athymic mice were injected with EIF1AX‐overexpressing or EIF1AX shRNA‐expressing MCF‐7 cells. Representative tumour images (F) and the average tumour mass (G). Each point represents the mean ± SD *P < .05, Student's t test
