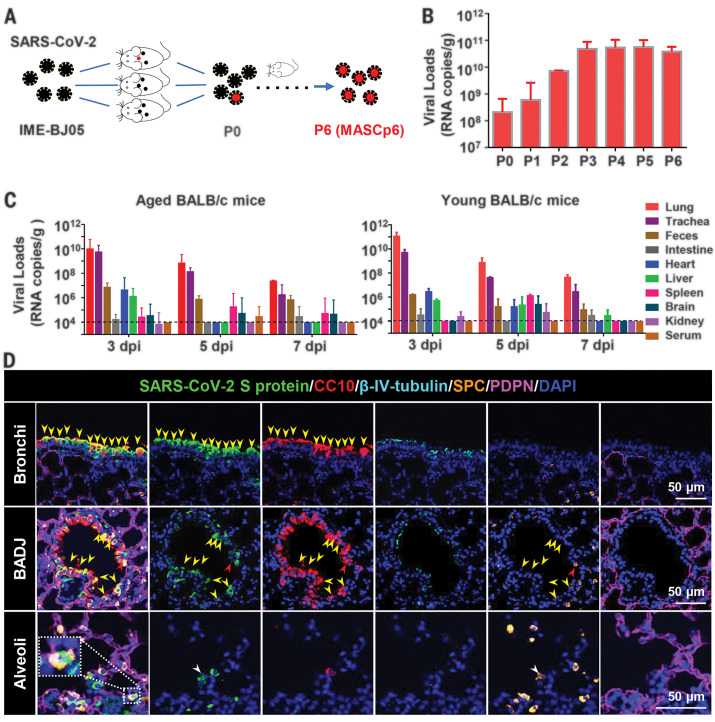
Fig. 1. Generation and characterization of a mouse-adapted strain of SARS-CoV-2 in BALB/c mice.
(A) Schematic diagram of the passage history of SARS-CoV-2 in BALB/c mice. The original SARS-CoV-2 viruses are shown in black, and the adapted viruses are in red. (B) SARS-CoV-2 genomic RNA loads in mouse lung homogenates at P0 to P6. Viral RNA copies were determined by means of quantitative reverse transcription polymerase chain reaction (RT-PCR). Data are presented as means ± SEM (n = 2 to 4 mice per group). (C) Tissue distribution of SARS-CoV-2 viral RNAs in mice infected with MASCp6. Groups of aged and young mice were inoculated with 1.6 × 10⁴ PFU of MASCp6 and sacrificed at 3, 5, or 7 days after inoculation, respectively. Feces, sera, and the indicated tissue samples were collected at the specified times and subjected to viral RNA load analysis by means of quantitative RT-PCR. Dashed lines denote the detection limit. Data are presented as means ± SEM (n = 3 mice per group). (D) Multiplex immunofluorescence staining of mouse lung sections. SARS-CoV-2 S protein (green), CC10 (red), β-IV-tubulin (cyan), PDPN (magenta), SPC (gold), and nuclei (blue). The dash box is magnified at the bottom right corner of the same image. Yellow arrowheads indicate SARS-CoV-2+/CC10+ cells, redarrow heads indicate SARS-CoV-2+/CC10+/SPC+ cells, and the white arrowheads indicate SARS-CoV-2+/SPC+ cells.

