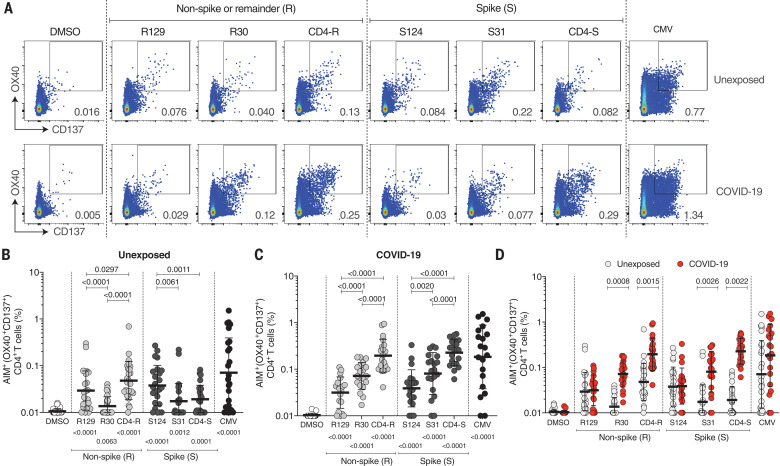
Fig. 2. CD4+ T cells in SARS-CoV-2–unexposed and recovered COVID-19 patients against HCoV epitopes homologous to SARS-CoV-2 epitopes.
(A) Example of flow cytometry gating strategy for antigen-specific CD4+ T cells based on activation-induced marker assays (OX40+ and CD137+ double expression) after stimulation of PBMCs with HCoV or SARS-CoV-2 peptides. (B to D) Antigen-specific CD4+ T cells measured as the percentage of activation-induced marker assay–positive (OX40+CD137+) CD4+ T cells after stimulation of PBMCs with HCoV epitopes homologous to SARS-CoV-2 epitopes. Samples were derived from SARS-CoV-2–unexposed donors (n = 25) and recovered COVID-19 patients ( n = 20). Black bars indicate the geometric mean and geometric SD. Each dot is representative of an individual subject. Statistical pairwise comparisons [(B) and (C)] were performed with the Wilcoxon test. P values related to comparisons with the DMSO controls are listed at the bottom of the graphs, and any significant P values related to intergroup comparisons are listed on top of the graphs. Statistical comparisons across cohorts were performed with the Mann–Whitney test (D). See also figs. S5 and S6.

