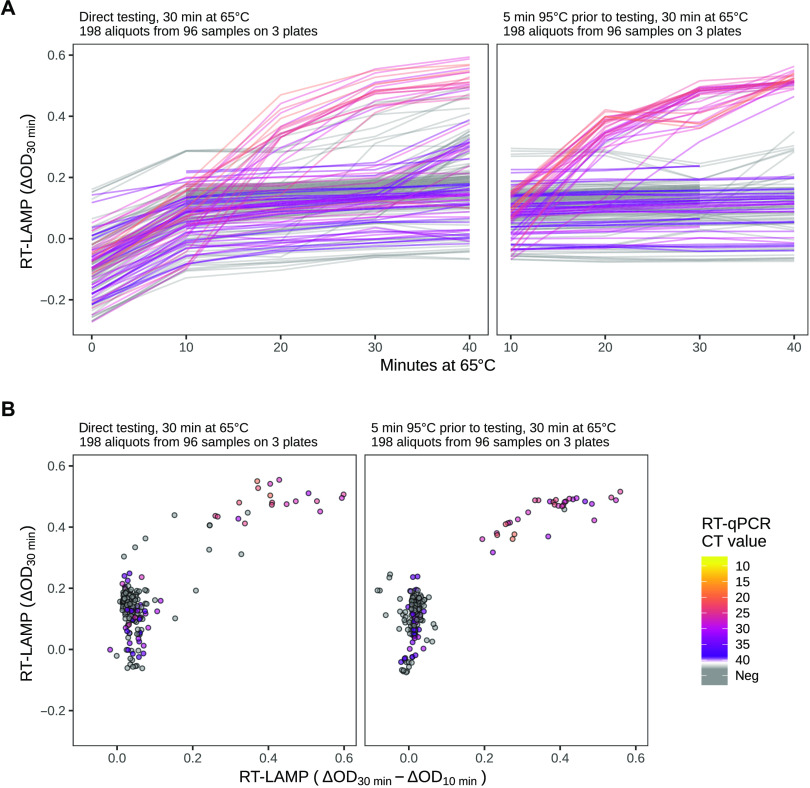
Fig. 6. Colorimetric readouts of the swab–to–RT-LAMP assay over time.
(A) The colorimetric readouts (ΔOD) for the direct (left) and hot (right) swab–to–RT-LAMP assays were assessed every 10 min. Heterogeneity is notable at the early time points. ΔOD values at the zero time point were not measured for the hot swab–to–RT-LAMP assay. Also, the 40-min time point was not available for one plate. The kink in some lines at 30 min (right) was due to a transient equipment malfunction. (B) Comparison of two scoring schemes. The readout used in Fig. 5 to score the direct (left) and hot (right) swab–to–RT-LAMP assays, namely, ΔOD at 30 min, is shown on the y axis, and compared to an alternative score, namely, the difference between the ΔOD signals at 30 min and at 10 min after the start of incubation, shown on the x axis. The latter shows better separation between positive and negative samples.

