
Figure 5.
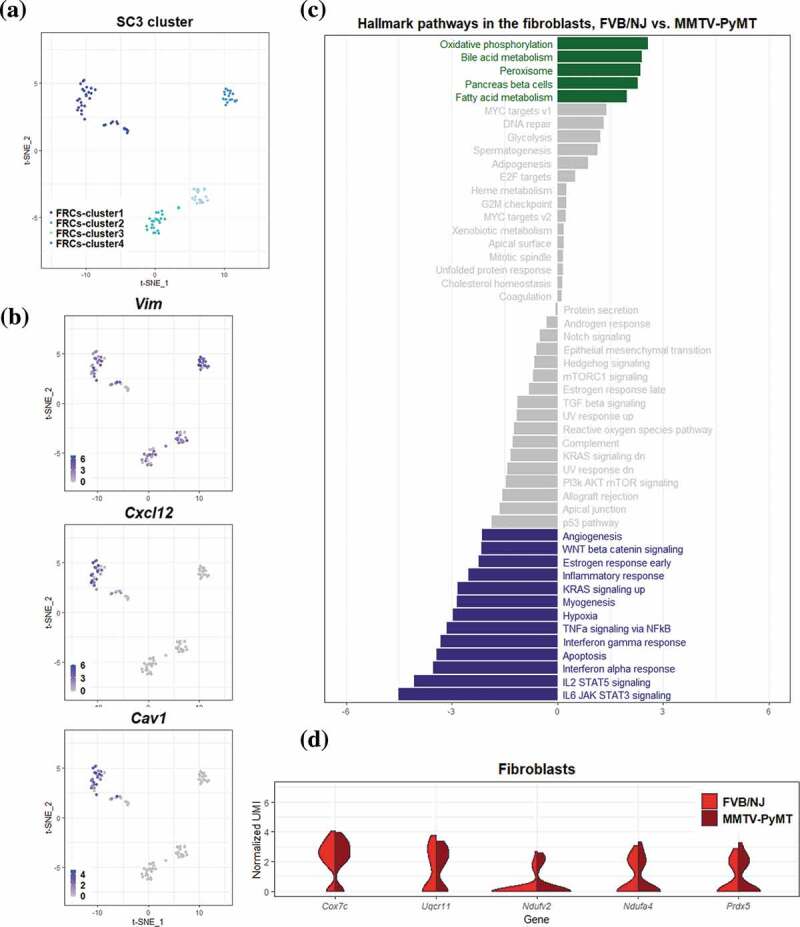
Differential transcriptomic analysis of FRCs between the FVB/NJ and MMTV-PyMT samples
(A-B) FRCs cells in tSNE plots, color-coded by cluster ID of SC3 (A), and by putative FRCs marker genes (B). (C) Bar chart representation of the results of GSVA based on hallmark gene sets. The value in the bottom represents the difference between the enrichment scores (ESs) of a gene set in the FVB/NJ and in MMTV-PyMT samples, and a positve value represents upregulation of a gene set/pathway in PyMT sample. Bar colored in gray represents q value > 0.1. (D) Violin plots showing the distribution of gene expression levels of top 5 upregulated genes in FRCs of MMTV-PyMT relative to FVB/NJ samples.