Figure 5.

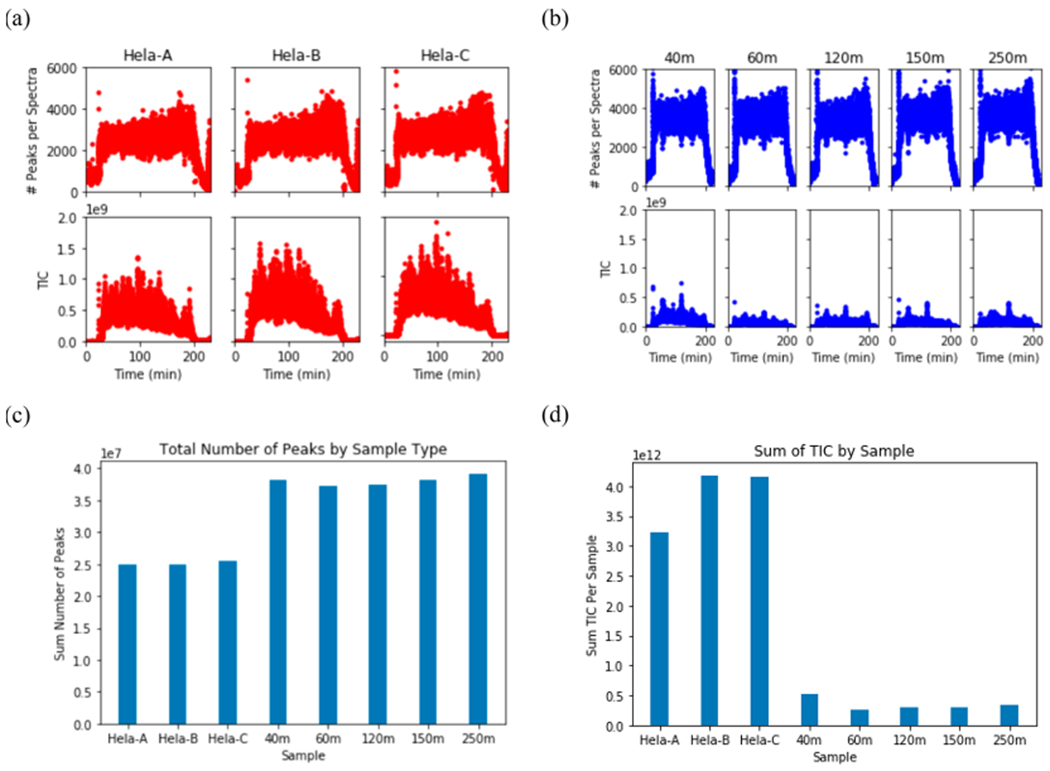
Peak analysis of human cell line and ocean metaproteome samples by identical chromatographic and mass spectrometry conditions. (a–b) Number of peaks identified in replicates (top rows) and the total ion current (TIC, bottom rows) of the sample in Hela (Panel A, replicates Hela-A, Hela-B, and Hela-C) and an ocean metaproteome sample (Panel B, depth 40, 60, 120, 150, and 250 m, Metzyme Expedition Station 3). Samples were run during the same week on the same nanospray column (see methods) with similar amounts of protein injected (0.5 μg for Hela per injection, 1 μg for ocean metaproteome). (c) Total number of peaks by sample type showed a higher number peaks in ocean metaproteome samples consistent with Figure 4, while (d) TIC by sample showed much lower summed peak intensity within the metaproteome samples.
