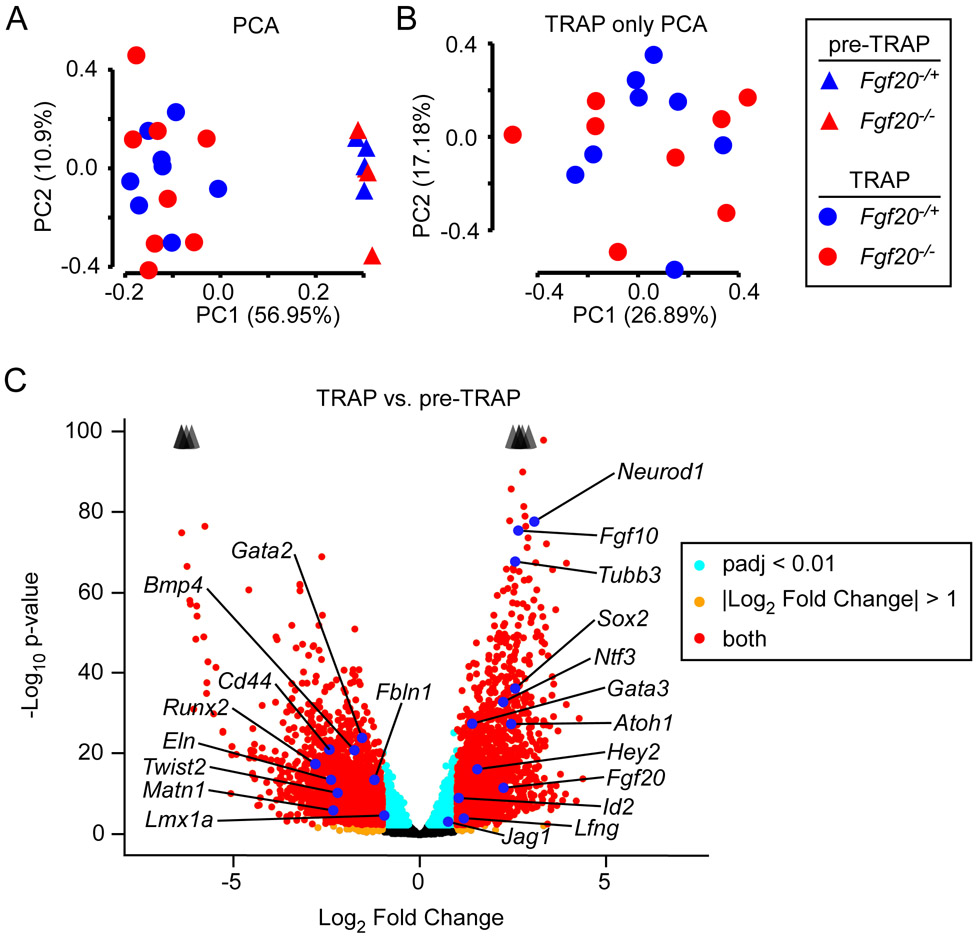
Figure 2. Fgf20Cre TRAPseq enriched for prosensory domain RNA.
(A) Principal Component Analysis (PCA) on 24 TRAPseq samples (8 pre-TRAP samples – 4 Fgf20−/+, 4 Fgf20−/−; 16 TRAP samples – 8 Fgf20−/+, 8 Fgf20−/−) showing separation of pre-TRAP and TRAP samples along PC1, but not of Fgf20−/+ and Fgf20−/− samples.
(B) PCA on the 16 TRAP samples (excluding the 8 pre-TRAP samples) also did not show separation between Fgf20−/+ and Fgf20−/− samples along the first two principal components.
(C) Volcano plot showing TRAP vs. pre-TRAP differentially expressed genes. Positive Log2 Fold Change value indicates enrichment by TRAP; negative Log2 Fold Change value indicates depletion by TRAP. Labeled genes represent markers of the prosensory domain, Kölliker’s organ, spiral ganglion, outer sulcus, periotic mesenchyme, and otic capsule. Padj, adjusted p-value for multiple comparisons (Benjamini-Hochberg method). The p-value plotted on y-axis is unadjusted. Arrowheads indicate genes above y-axis range.

