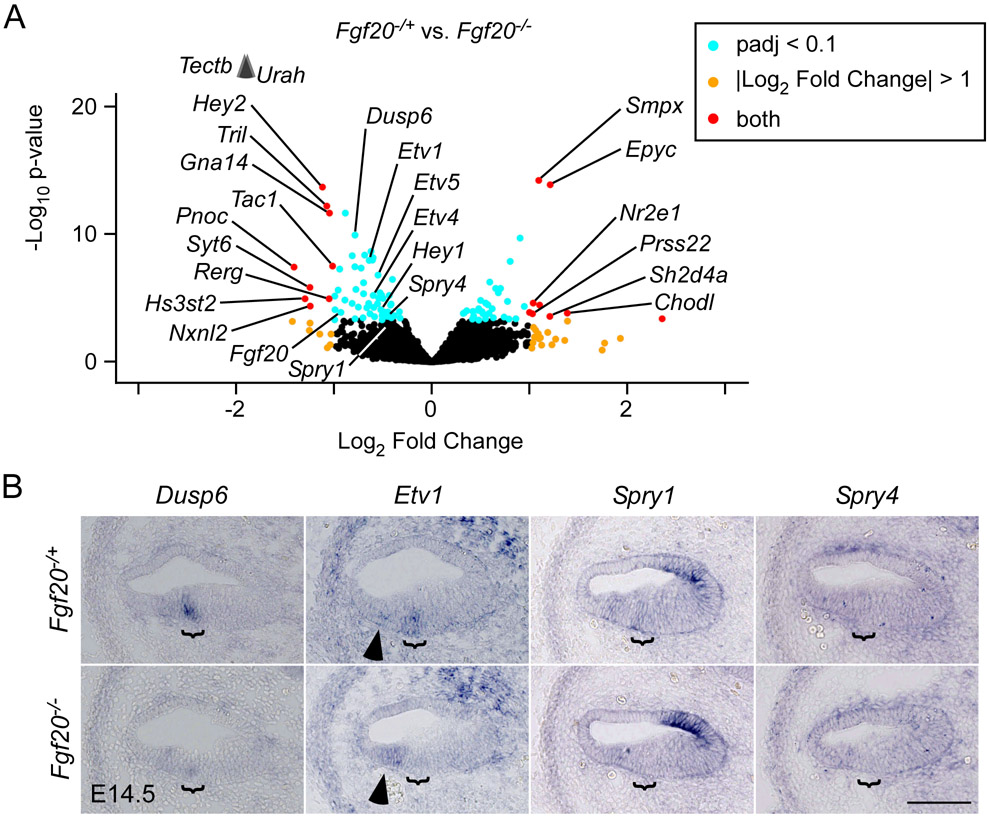
Figure 3. TRAPseq revealed known FGF target genes during organ of Corti differentiation downstream of Fgf20.
(A) Volcano plot showing Fgf20−/+ vs. Fgf20−/− differentially expressed genes. Fgf20, transcripts associated with FGF signaling, and transcripts meeting the criteria padj < 0.1 and Log2 Fold Change < −1 or > 1 are labeled, with the exception of predicted genes and unnamed transcripts. padj, adjusted p-value for multiple comparisons (Benjamini-Hochberg method). The p-value plotted on the y-axis is unadjusted. Arrowheads indicate genes above the y-axis range.
(B) RNA in situ hybridization for known FGF target genes Dusp6, Etv1, Spry1, and Spry4 on sections through the middle turn of E14.5 Fgf20−/+ (Fgf20Cre/+) and Fgf20−/− (Fgf20Cre/βgal) cochlear ducts. Bracket, prosensory domain. Arrowhead, increased expression of Etv1 in the outer sulcus of Fgf20−/− cochleae. Scale bar, 100 μm.

