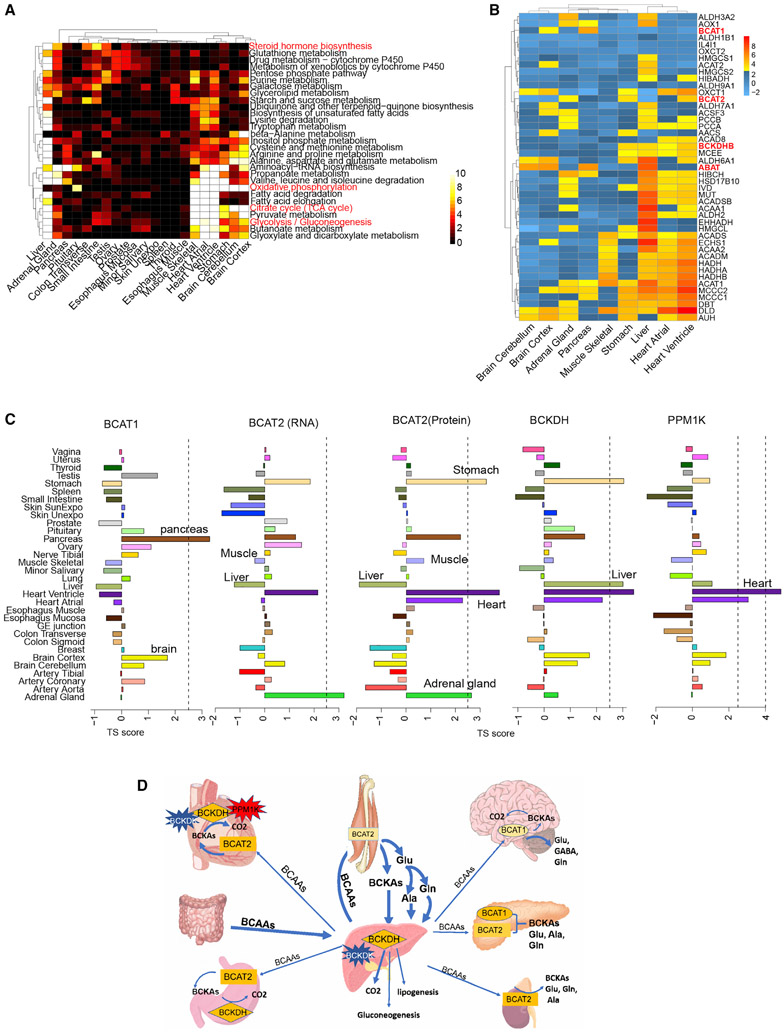
Figure 4. Analysis of Tissue-Specific Metabolism.
(A) Enrichment of a subset of metabolic pathways across different tissues. The heatmap shows the significance of the -log(p values) from the pathway enrichment test. The plot only includes the tissues having at least one significantly enriched pathway under threshold of 0.001 for the p value from Fisher’s exact test.
(B) The enrichment map of key enzymes in BCAA metabolism.
(C) Tissue enrichment of the first-step enzyme BCAT1/2 and the second-step enzyme BCKDH and its activator PPM1K.
(D) Interactive map of BCAA shuttling among tissues and the enriched enzymes.

