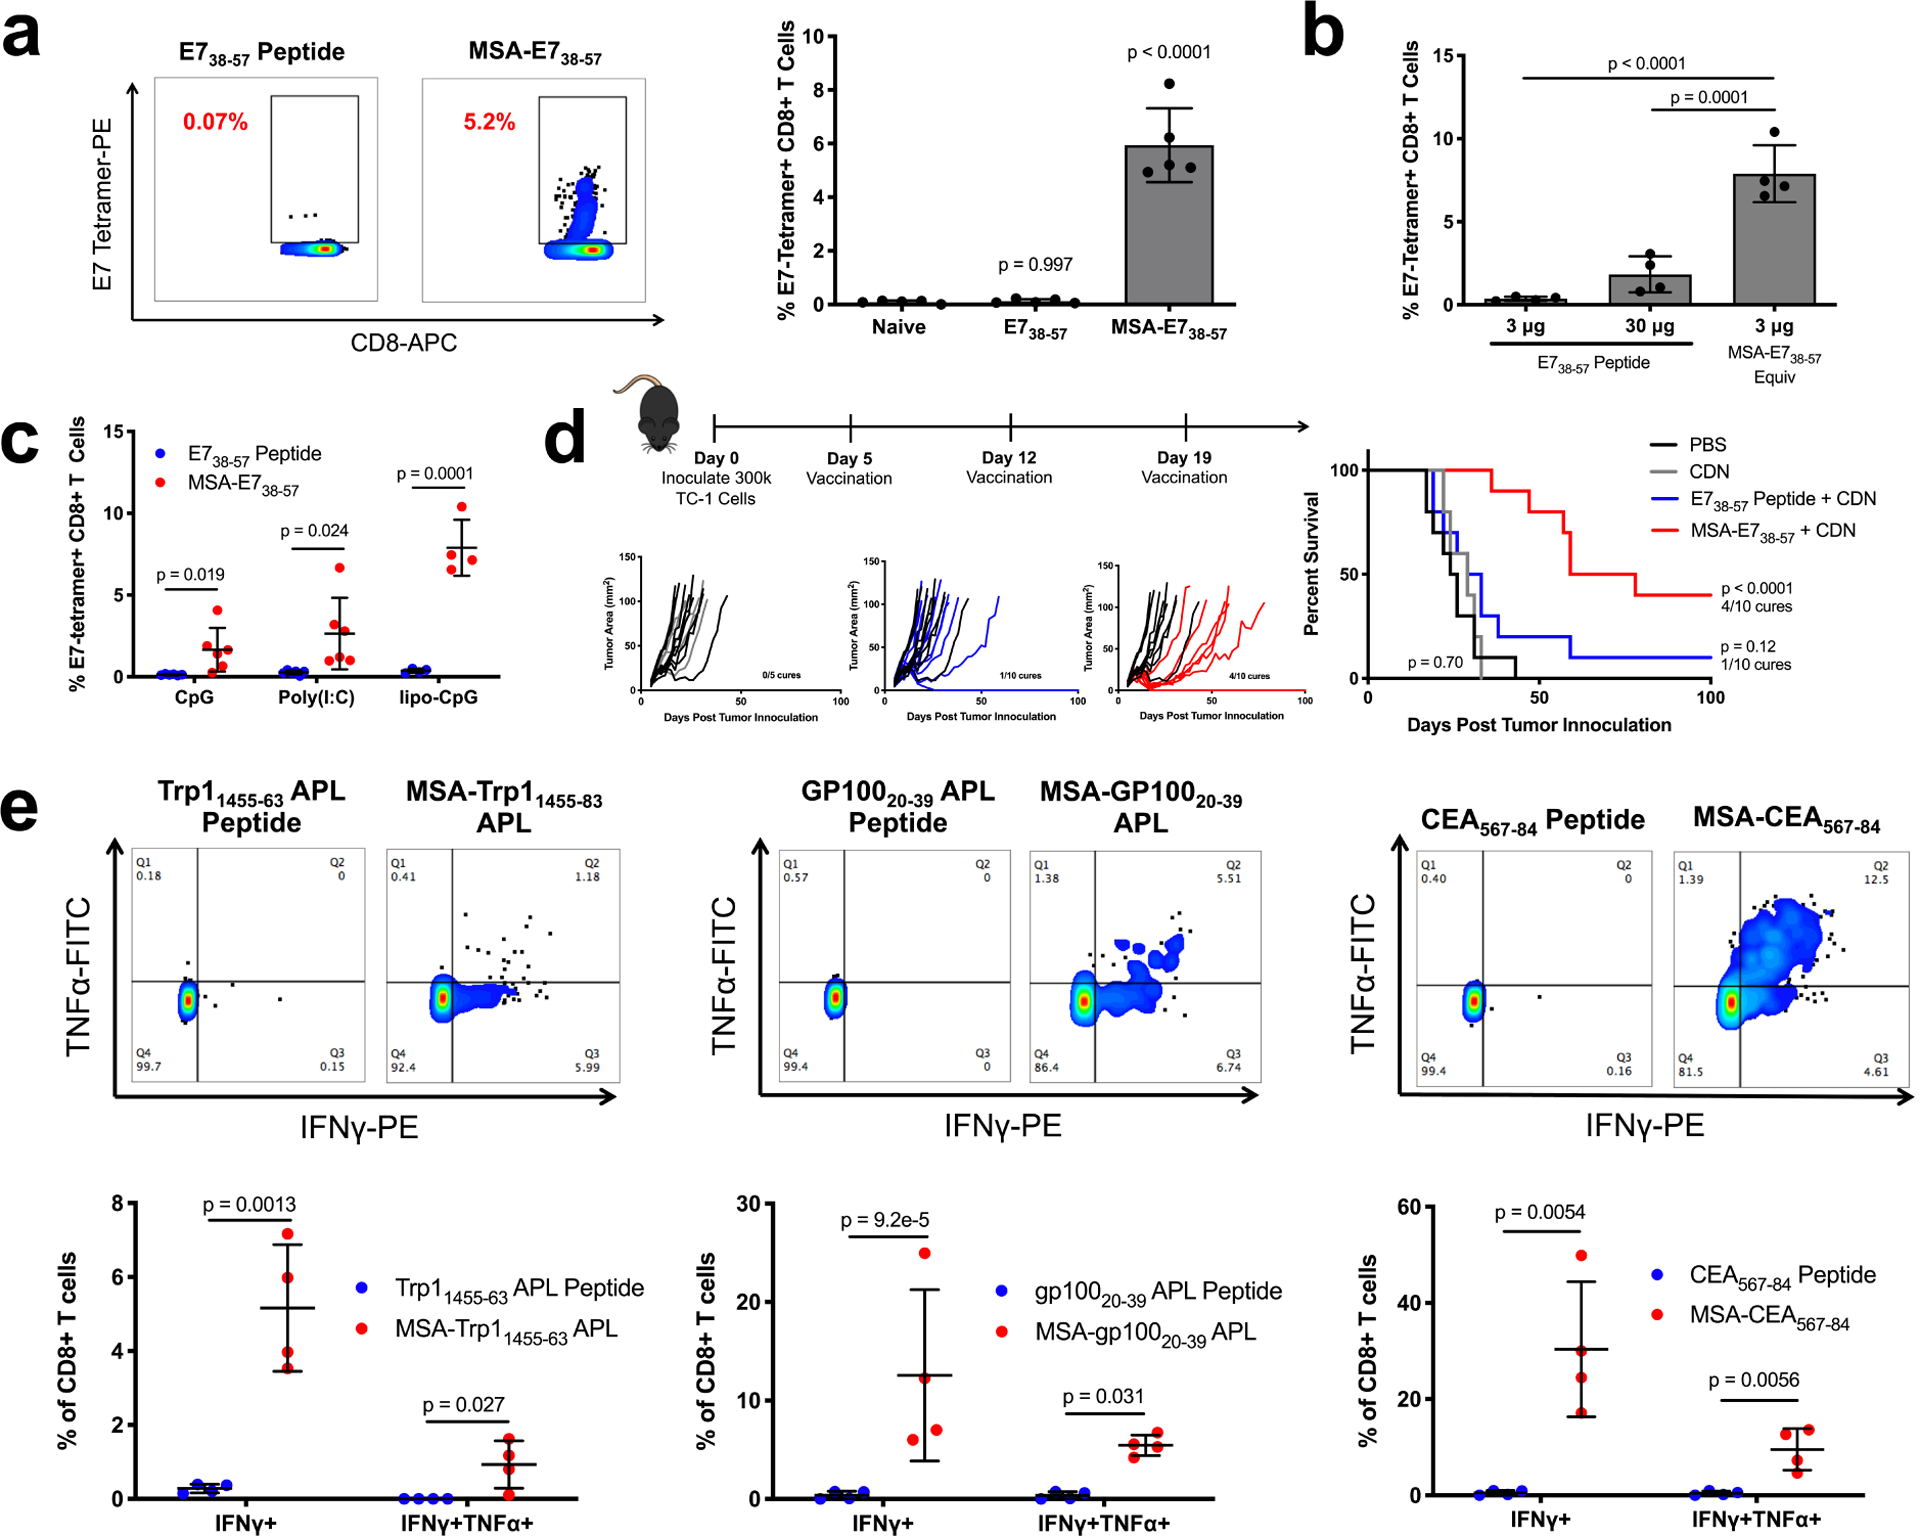
Figure 2.

Albumin delivery of epitopes is a generalizable immunogenicity enhancement strategy. (a) Mice were primed and boosted with E738–57 or MSA-E738–57 and CDN subcutaneously. Shown are representative tetramer stain flow plots among CD8+ T cells 6 days after boost, and quantification (mean ± SD, n = 5 mice per group). Data are representative of over five independent experiments. (b) Mice were primed and boosted with E738–57 or MSA-E738–57 as in (a) at the indicated doses. Shown are tetramer stain data among CD8+ T cells 6 days after boost (mean ± SD, n = 4 mice per group). (c) Mice were primed and boosted with E738–57 or MSA-E738–57 and the indicated adjuvants subcutaneously. Shown are tetramer stain data among CD8+ T cells 6 days after boost (mean ± SD, n = 6 mice per group for CpG and poly(I:C) and n = 4 mice per group for lipo-CpG). (d) Timeline and treatment schematic of TC-1 tumor study, along with tumor growth plots and survival curves (n = 5 mice for CDN and n = 10 mice for all other groups). Data are compiled from two independent experiments. (e) Mice were primed and boosted with the indicated antigens as in (a). 6 days after boost, peripheral blood cells were stimulated for 6 hours with WT optimal antigenic peptides in the presence of brefeldin A. Shown are representative flow cytometry plots plots for intracellular cytokine staining among CD8+ T cells and quantification (mean ± SD, n = 4 mice per group). Statistical significance calculated one-way ANOVA with Dunnett’s multiple comparisons test against naïve (a), one-way ANOVA with Tukey’s multiple comparisons test between all groups (b), two-tailed t tests between groups on the x-axis with Holm-Sidak multiple comparisons test (c,e), or two-tailed log-rank (Mantel-Cox) test versus PBS (d).
