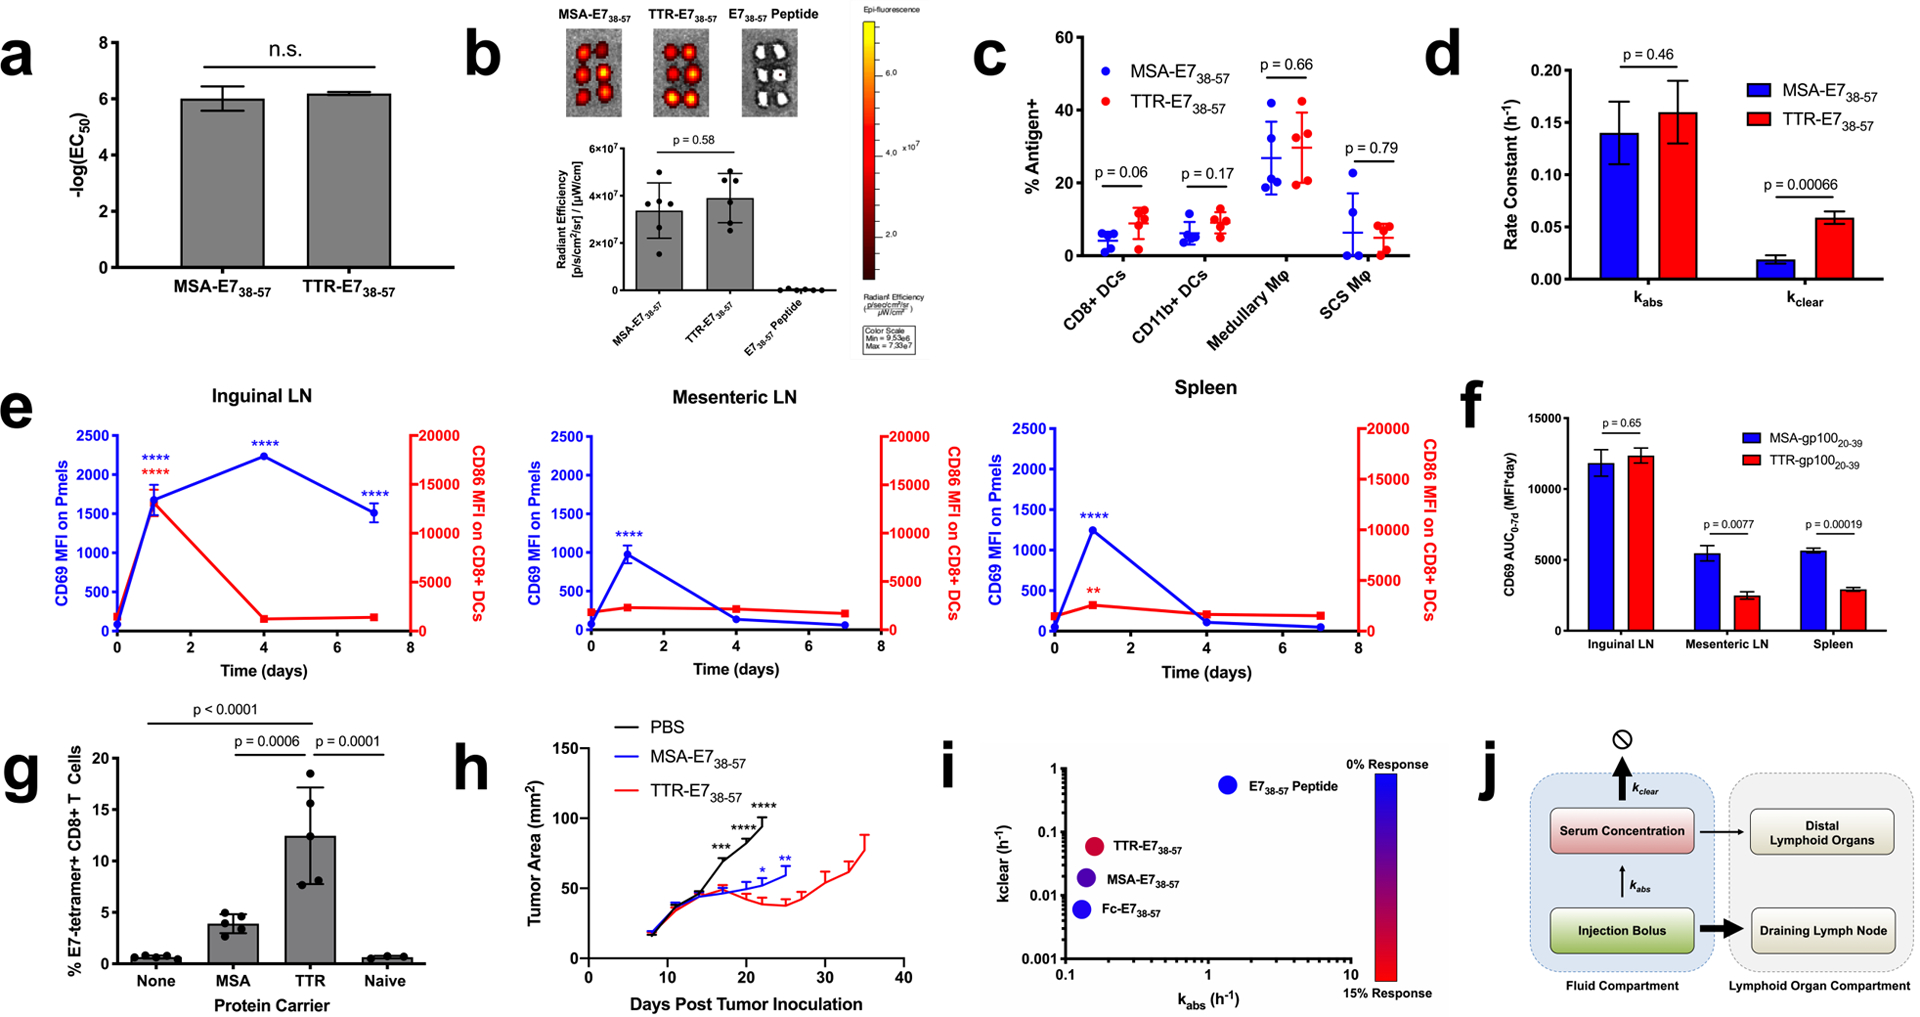
Figure 4.

TTR fusions outperform MSA fusions due to a faster clearance rate. (a) EC50 values calculated from splenocyte restimulation studies with the indicated antigen (n = 3). (b) FITC-labeled antigen uptake in the dLN was measured as in Fig. 1f (mean ± SD, n = 6 lymph nodes per group). (c) AF488-labeled MSA-E738–57 or TTR-E738–57 was injected subcutaneously in mice. 24 hours later, the inguinal lymph node was excised and AF488 signal in APCs assessed by flow cytometry (mean ± SD, n = 5 mice per group). (d) Shown are kabs and kclear values as calculated via nonlinear regression from pharmacokinetic studies (fit data ± SE). (e) Pmel CD69 and CD8+ DC CD86 MFIs are shown (mean ± SEM, n = 3 mice per group). (f) Area under the curve calculations from CD69 MFI in Fig. 3d and Fig. 4e (calculated AUC ± SE) (g) Mice were primed and boosted with the indicated vaccine plus CDN subcutaneously. Shown are tetramer stain data among CD8+ T cells 6 days after boost (mean ± SD, n = 5 mice per group). Data are representative of over five independent experiments. (h) Mice were implanted with TC-1 tumor cells and immunized on days 8 and 15 with the indicated vaccine. Shown are tumor growth curves of the indicated groups (mean + SEM). Curves are plotted until the first mouse is euthanized in each group (n = 9 mice per group) (i) Mice were primed and boosted with the indicated vaccine plus CDN subcutaneously. Tetramer stain data are indicated by color overlaid on a kabs and kclear scatterplot. (j) Schematic of pharmacokinetic parameters that maximize bioavailability in the inflamed dLN. Statistical significance calculated using two-tailed t tests either alone (a) or with Holm-Sidak multiple comparisons test (c,d,f), one-way ANOVA with Tukey’s multiple comparisons test between all groups (b,g), or with Dunnett’s multiple comparisons test against the day zero time point for each measurement (e). In (h), two-tailed t tests were performed at each measurement comparing against TTR-E738–57. In (e, h), ** p < 0.01; *** p < 0.001; **** p < 0.0001.
