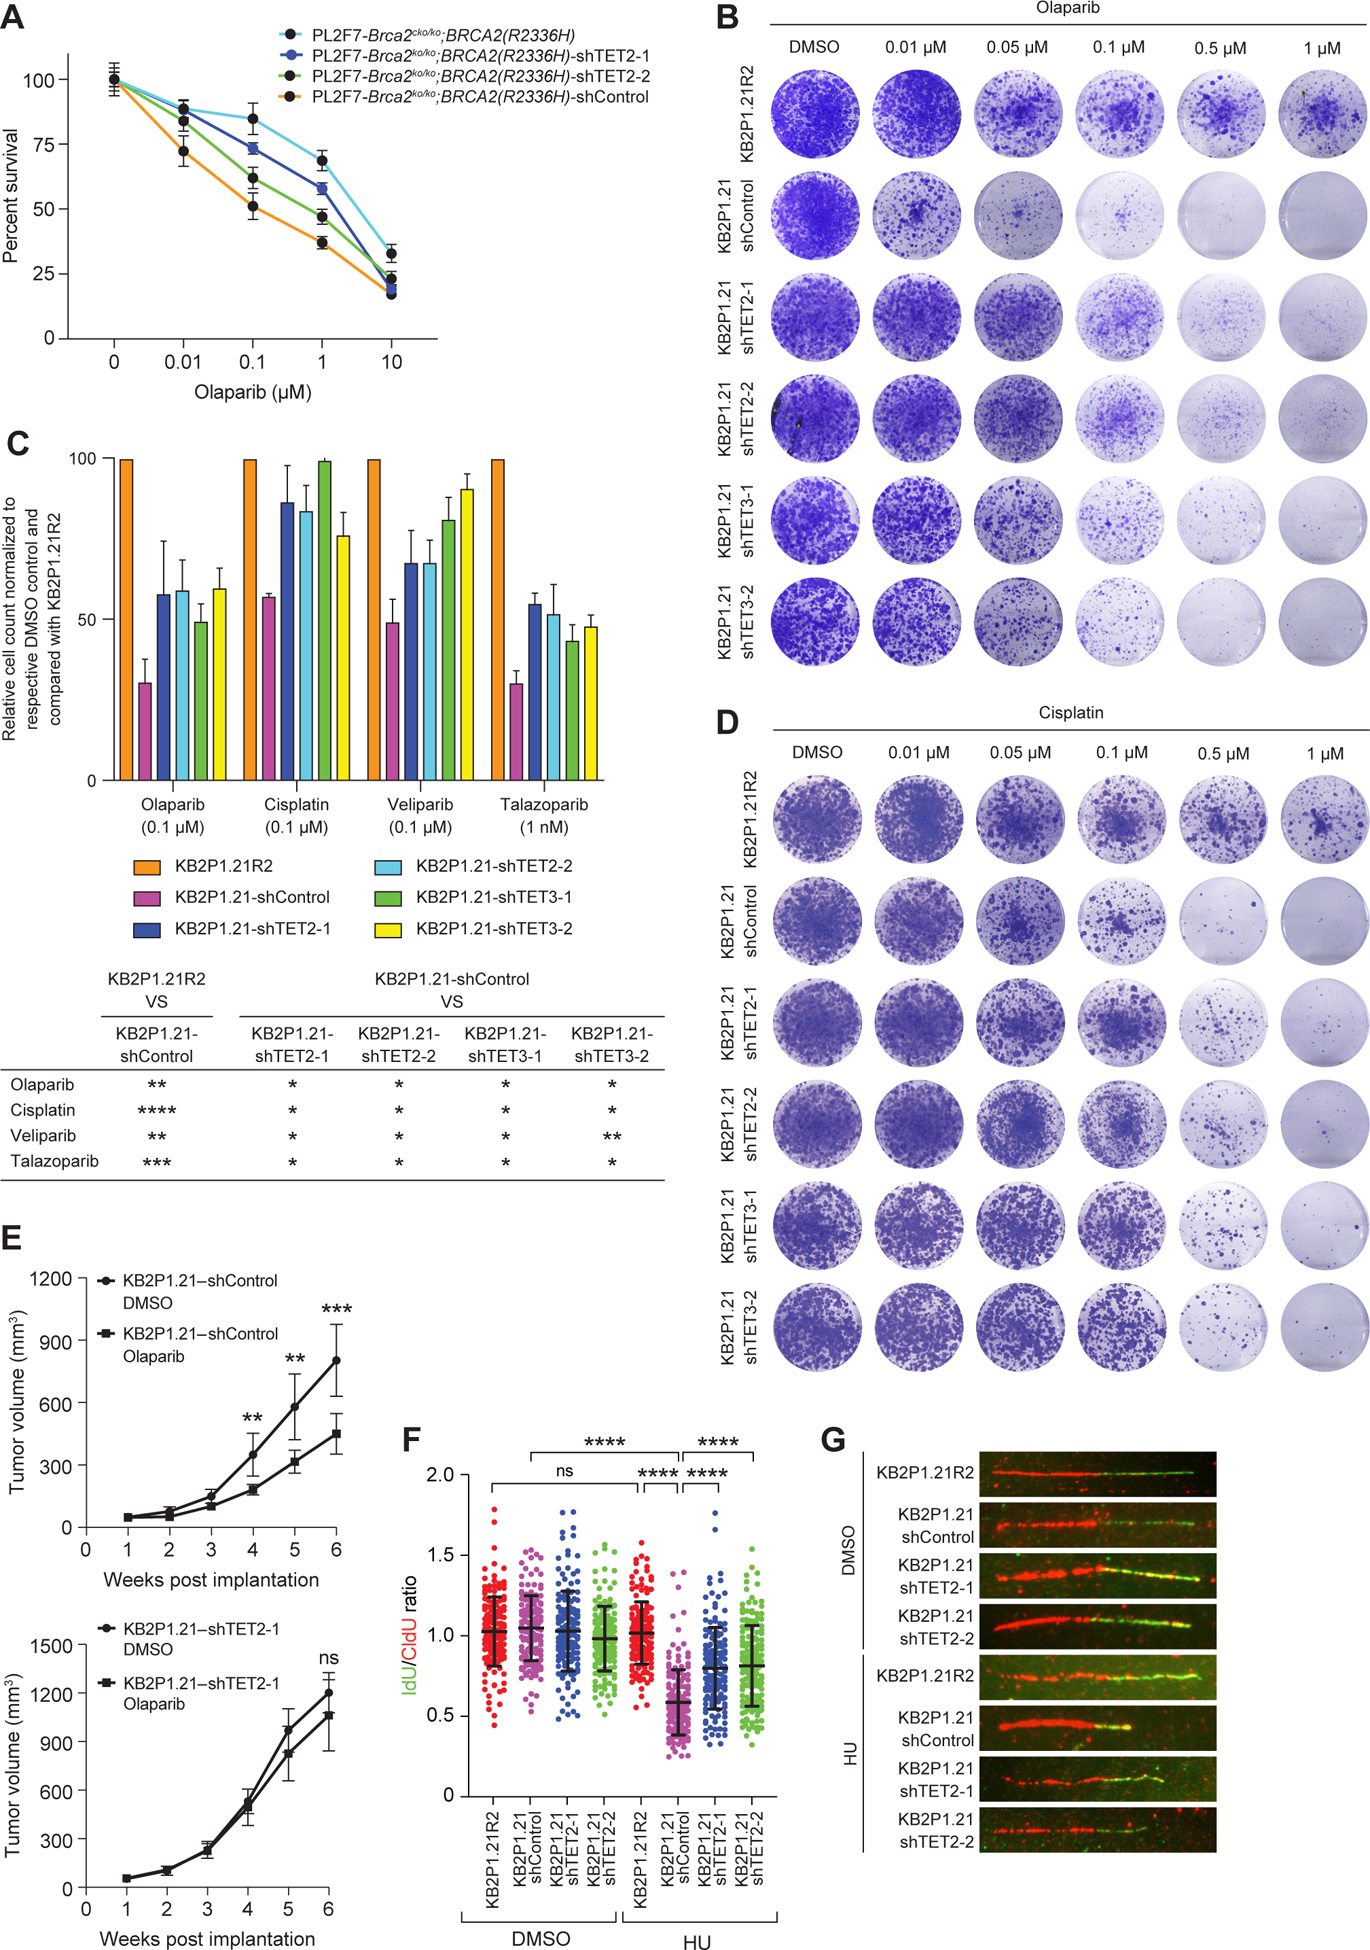
Figure 1. Loss of TET confers drug resistance to PARPi and cisplatin and restores RF stability in BRCA2-deficient cells.

(A) Viability of the indicated control or TET2-knockdown PL2F7-Brca2ko/ko;BRCA2(R2336H) and PL2F7-Brca2cko/ko;BRCA2(R2336H) mES cells to increasing concentrations of olaparib (DMSO, 0.01, 0.1, 1, 10μM), as measured by the XTT assay for 96 hours. Values were normalized to a respective DMSO-treated control. Data are mean ± SD of technical triplicates from 2 independent experiments. (B) Clonogenic survival assay was performed for 14 days in KB2P1.21-shControl, KB2P1.21-shTET2 and KB2P1.21-shTET3 cells (both with each of two shRNAs) treated with increasing concentrations of olaparib (DMSO, 0.01, 0.5, 0.1, 0.5, or 1 μM). Images are representative of 3 independent experiments. (C) Quantification of viability was assessed by hemocytometer in KB2P1.21-shTET2 and KB2P1.21-shTET3 cells treated with olaparib (0.1 μM), cisplatin (0.1 μM), veliparib (0.1 μM) and talazoparib (1 nM) for 14 days. Values are normalized to a respective DMSO-treated control, and calculated relative to KB2P1.21R2 cells treated with the respective drug. Below, table lists P-value thresholds for the indicated comparisons, by paired t-test: * P ≤0.05, ** P ≤ 0.01, *** P≤0.001, and **** P≤0.0001. Graph data are mean ± SD of technical triplicate from 2 independent experiments. (D) As described in (B), in cells treated with increasing concentrations of cisplatin. (E) Growth of allografted KB2P1.21-shControl (top; n = 7 and 8 mice) and KB2P1.21-shTET2 (bottom; n = 10 mice) cells in athymic nude mice treated with DMSO control or olaparib. (F and G) Scatter plot of the ratio of IdU:CldU DNA fibers [green:red in representative images, (G)] upon HU treatment (4 mM for 3 hours) in the indicated cell lines. N = 4 experiments, ~150 DNA fibers. Data in (E and F) are mean ± SD; ns P≥0.05, ** P ≤ 0.01, *** P≤0.001, and **** P≤0.0001, by ANOVA (E) or Mann-Whitney test (F).
