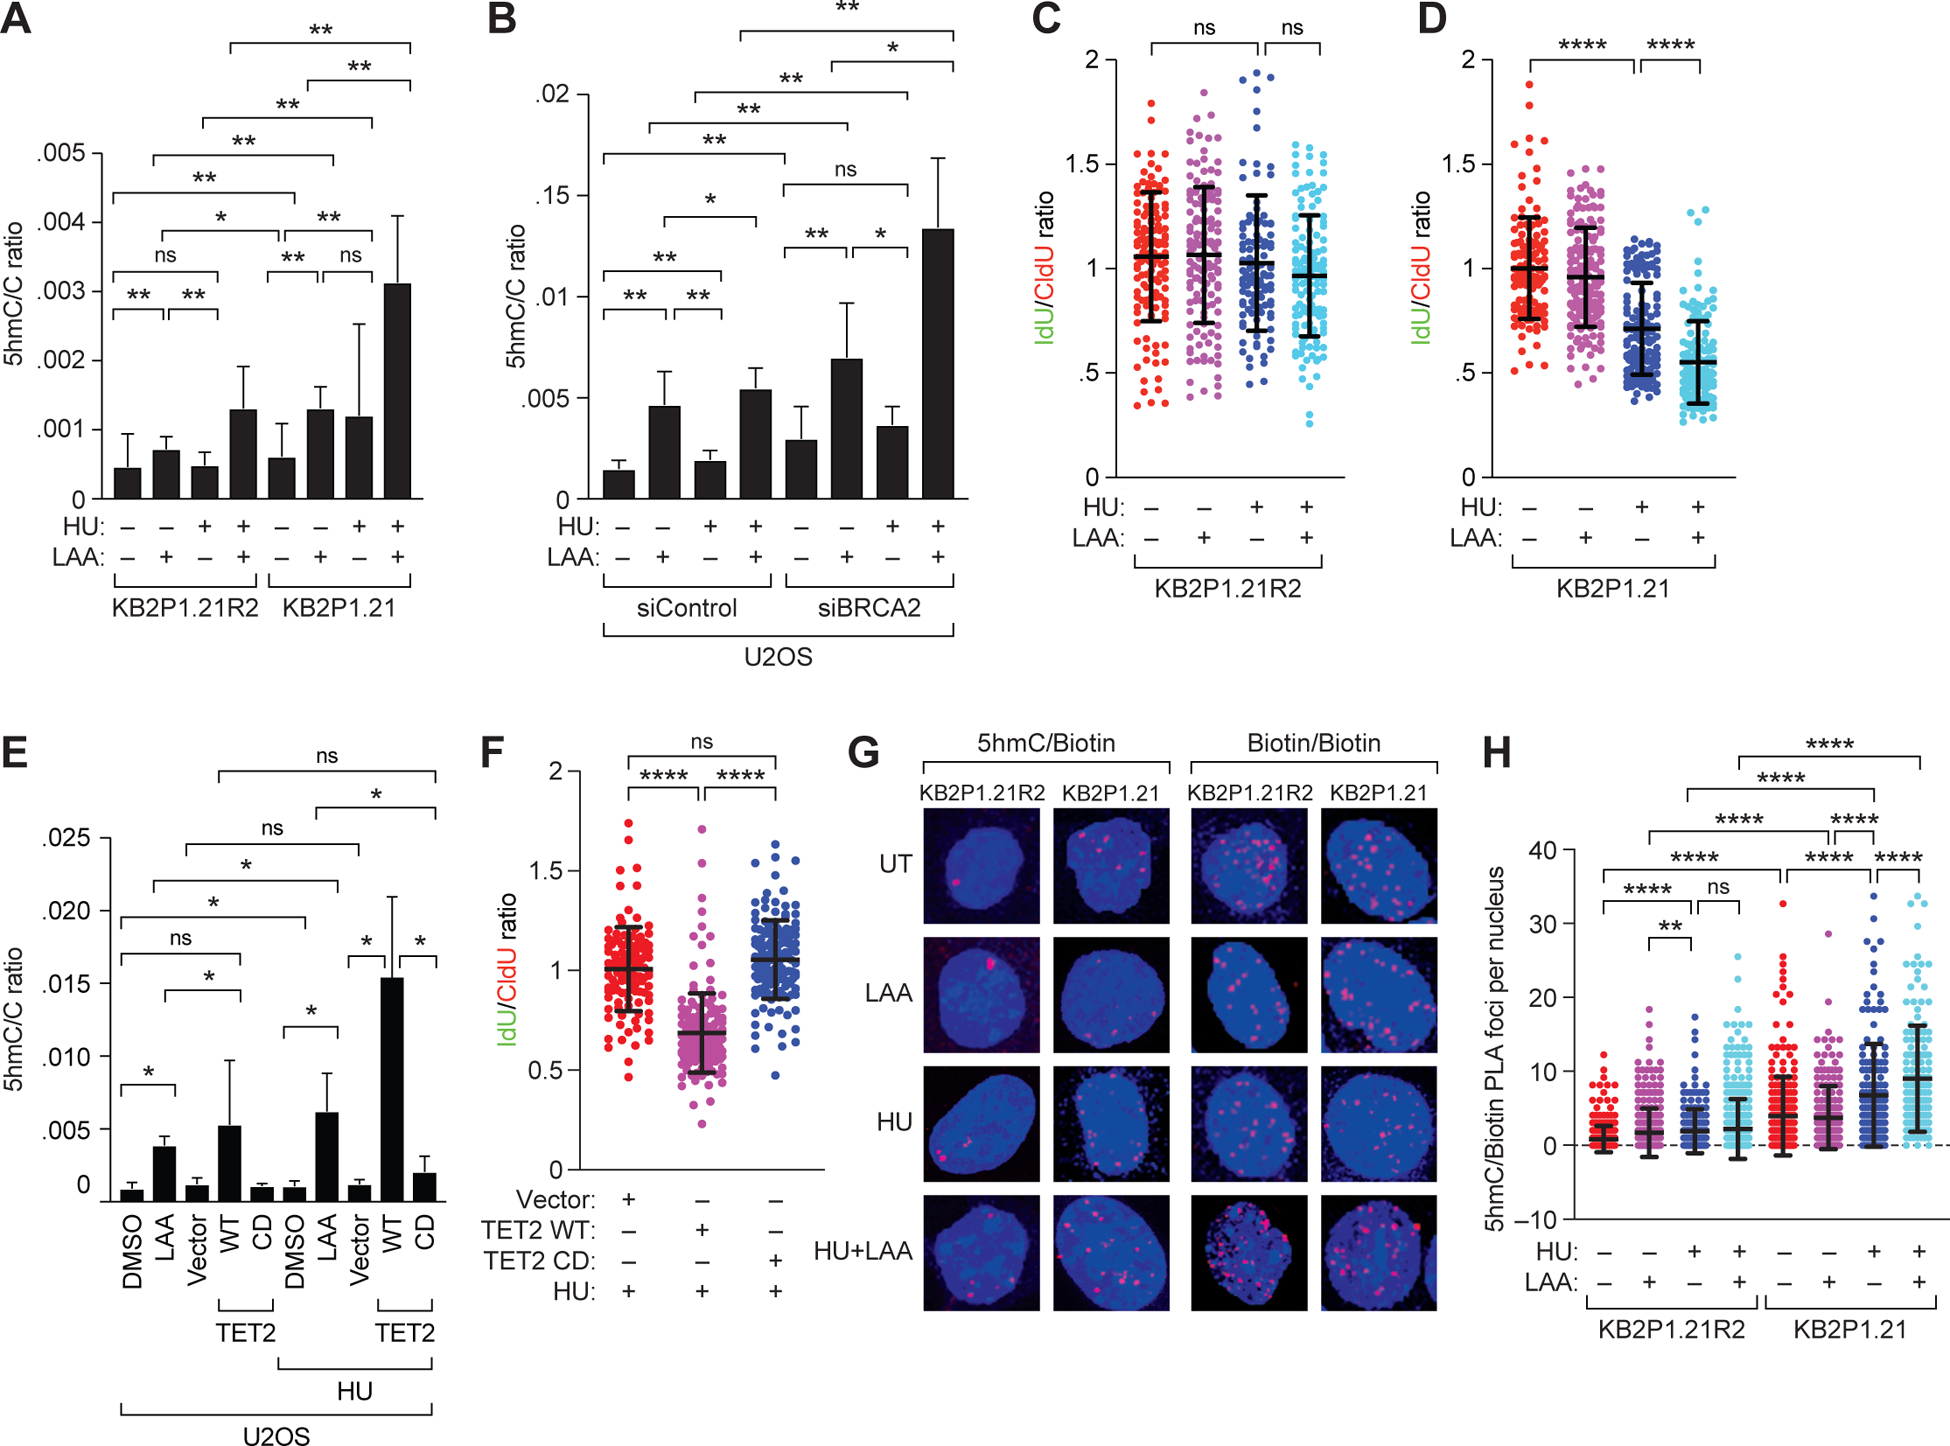
Figure 2. Increase in 5hmC at RFs is correlated with fork degradation.

(A and B) Mass spectrometry-based quantitation of 5hmC levels, as a ratio to that of cytosine, in (A) mouse mammary tumor cells KB2P1.21R2 (BRCA2-proficient) and KB2P1.21 (BRCA2-deficient) and (B) U2OS cells after transient knockdown of BRCA2, each upon treatment with L-ascorbic acid (LAA; 250 μM, 72 hours), HU (4mM, 3 hours), or both. (C and D) Scatter plot showing ratio of IdU:CldU DNA fibers in KB2P1.21R2 (C) and KB2P1.21 (D) cells upon treatment with HU, LAA or both. (E) Mass spectrometry-based quantitation of 5hmC levels, as a ratio to that of cytosine, in U2OS cells treated with DMSO or LAA, each with or without HU, and in U2OS cells after transient overexpression of wild-type (WT) or catalytically deficient (CD) TET2 (or empty vector), either untreated or treated with HU. (F) Scatter plot showing ratio of IdU:CldU DNA fibers in U2OS cells after transient expression of vector or wild-type (WT) or catalytically deficient (CD) TET2 followed by treatment with HU. (G and H) Representative images (G) and quantiation (H) of proximity ligation assays in EdU-biotin-labeled KB2P1.21R2 and KB2P1.21 cells using 5hmC and biotin antibodies in DMSO-treated cells or those treated with HU, LAA, or both. Scale bar, 5 μm. Biotin/biotin PLA using two distinct biotin antibodies served as an internal control for EdU incorporation. Data are mean ± SD from n = 2 (C, D, and H) or 3 (F) experiments, or from 2 experiments each in triplicate (A, B, and E); in each, N = ~150 DNA fibers. ns P ≥ 0.05, * P ≤ 0.05, ** P ≤ 0.01, and **** P ≤ 0.0001 by Mann-Whitney test.
