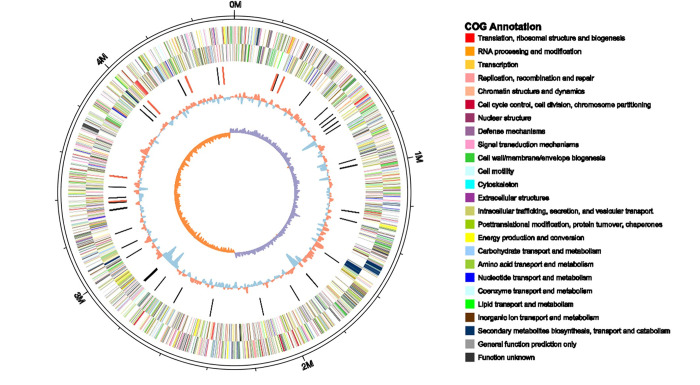
Fig 3. Circular visualization of the complete genome of D. zeae EC2.
From outside to inside, the circles indicate predicted genes on the positive strand, predicted genes on the negative strand, ncRNAs (black indicates tRNAs, red indicates rRNAs), G+C contents and GC skew values (GC skew = (G-C)/(G+C); purple indicates >0, orange indicates <0), respectively.

