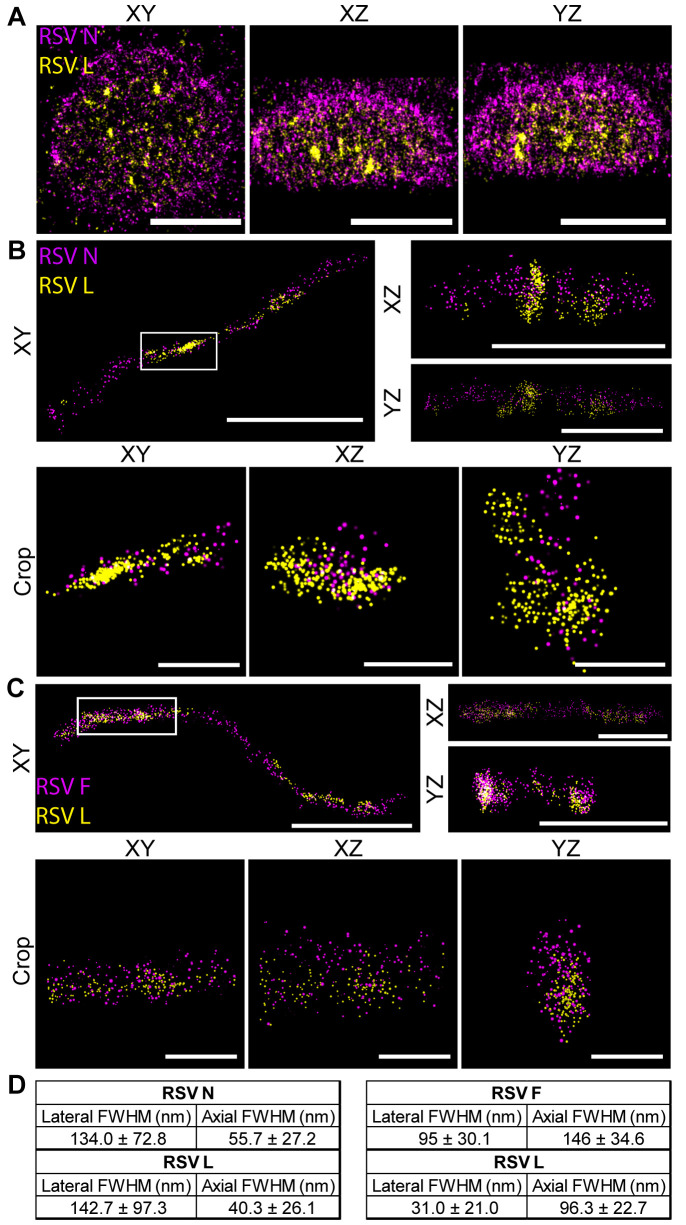
Fig 2. dSTORM images reveal RSV L localizes to the center of inclusion bodies and virions.
A) A549 cells were infected with rRSVflag(2)L at a MOI of 3. Cells were fixed at 24 hpi and stained for RSV L (yellow) and RSV N (magenta). Representative dSTORM images of an inclusion body are shown, with a 2 μm scale bar. XY views, as well as XZ and YZ, are shown. B) Viral filaments on glass were stained for RSV L (yellow) and RSV N (magenta). XY views, as well as XZ and YZ, are shown, with a 1 μm scale bar. The white boxed region represents a 500 nm cropped region shown below in the XY, XZ, and YZ views with 250 nm scale bars. C) Viral filaments on glass were stained for RSV L (yellow) and RSV F (magenta). XY views, as well as XZ and YZ, are shown, with a 1 μm scale bar. The white boxed region represents cropped region shown below in the XY, XZ, and YZ views with 250 nm scale bars. D) Tables with full width at half maximum (FWHM) of the point count of the crops in (B) (left) and (C) (right). This measurement was repeated for a total of n = 3 filaments.

