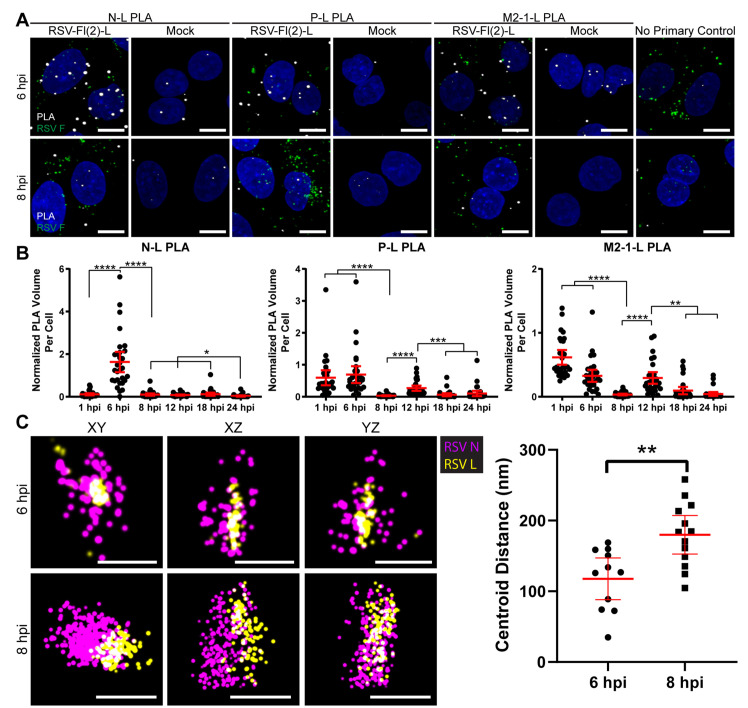
Fig 3. RSV proteins in the ribonucleocapsid complex rearrange between 6 and 8 hpi.
A) A549 cells were infected or mock infected with rRSVflag(2)L at a MOI of 3. Cells were fixed at 1, 6, 8, 12, 18, and 24 hours post infection. PLA (white) was performed between N-L, P-L, and M2-1-L. Cells were stained for RSV F (green) to select for positively infected cells. Duplicates were performed, but representative extended focus images from one experiment are shown. Scale bar is 10 μm. Images for additional timepoints are reported in S3 Fig. B) Quantification of PLA in (A) is shown. PLA volume was normalized by volume of RSV F in the cell. Mean and 95% confidence intervals are shown in red. Kruskal-Wallis tests with a Dunn’s multiple comparison test were performed, where n = 30 cells and * p < 0.05, ** p < 0.01, *** p < 0.001, and **** p < 0.0001. C) A549 cells were infected with rRSVflag(2)L at a MOI of 3 and fixed at 6 or 8 hpi. Cells were stained for L (yellow) or N (magenta) and ribonucleocapsid complexes imaged with dSTORM. XY, XY, and YZ views are shown, with a 200 nm scale bar. XYZ positions of the centroid of the L and N protein clusters were measured, and the distance between L and N were quantified. Mean and 95% confidence intervals are shown in red. 5–10 infected cells were imaged for each timepoint across two experiments A Welch t-test was performed, where n = 10 and ** p < 0.01.

