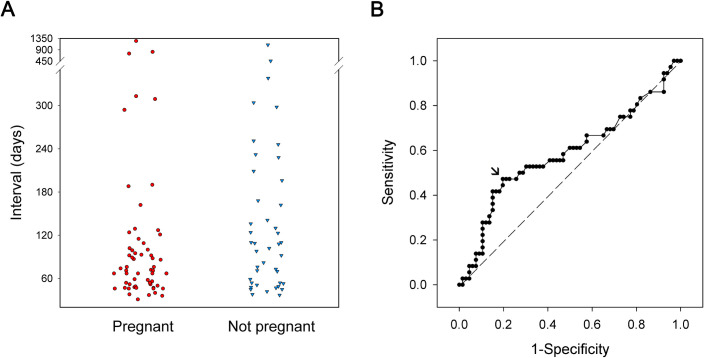
Fig 1. Interval of HSC-P to FET and biochemical pregnancy.
Scatter plot of the intervals between HSC-P and FET, stratified by biochemical pregnancy outcome (A). The ROC curve for the probability of achieving chemical pregnancy at each different interval between HSC-P and FET (B). The point with the greatest trade-off between sensitivity and specificity, as determined by the Youden index, is at an interval of 120 days (AUC = 0.585, SE = 0.063, 95% CI from 0.462 to 0.708).

