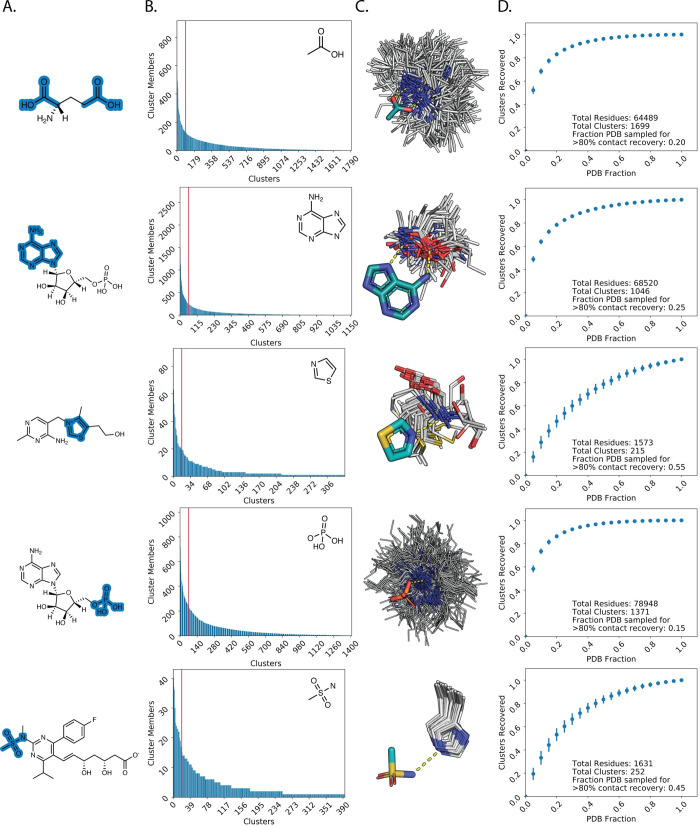
Fig 2. PDB sufficiently samples ligand-fragment contact space.
A. Examples of fragment definitions (highlighted in blue) and context as a substructure of a small molecule. B. Clusters for each fragment are plotted in order of the number of members for each cluster (“contact mode”). Clusters to the left of the red vertical line represent the top 5% (high-occupancy) contact modes. C. Examples of high-occupancy clusters for fragments that illustrate expected favorable contact modes. White lines: clustered side chain contacts, teal: fragment carbons, orange: phosphorous, yellow: sulfur, red: oxygen, blue: nitrogen. Hydrogen bonding contacts are depicted as yellow dashed lines. D. Average and standard deviation for the number of contact modes recovered at given fractions of the PDB.

