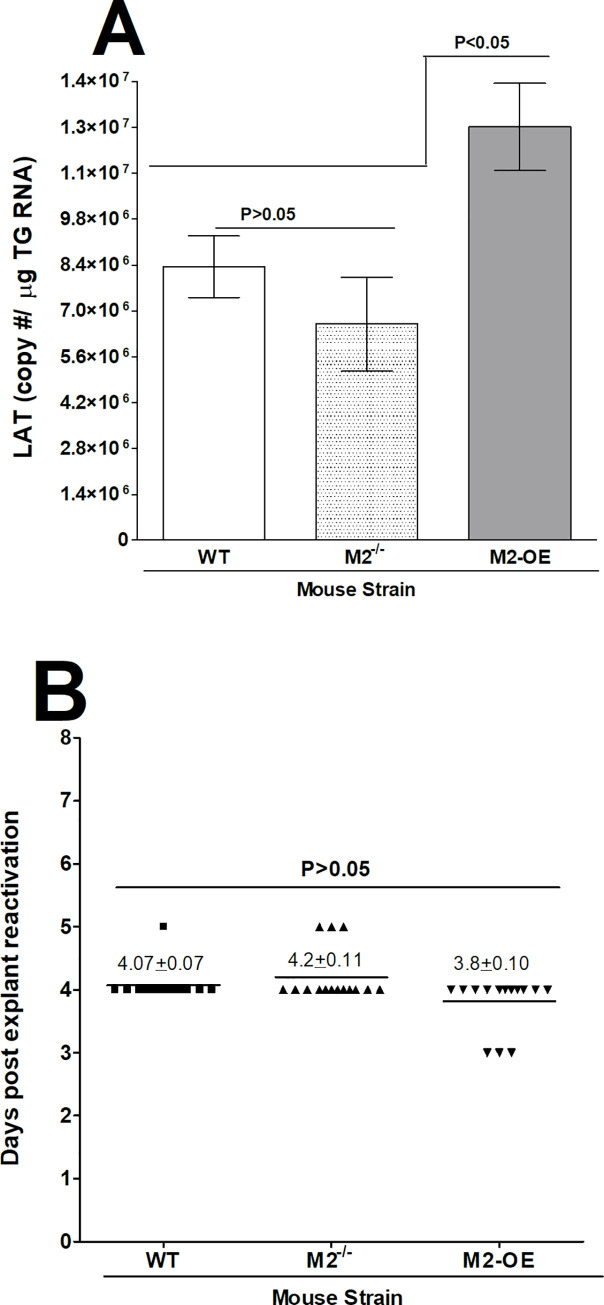
Fig 8. Level of latency and effect of HSV-1 infection on induced reactivation kinetics in explanted TG from latently infected mice.
(A) Level of latency in TG from latently infected mice. WT, M2-/-, and M2-OE mice were ocularly infected with 2 X 10⁵ PFU/eye of McKrae virus. To analyze latency levels in the TG of latently infected mice on day 28 PI, TG were harvested and Quantitative RT-PCR was performed on the individual TG from each mouse. In each experiment, an estimated relative LAT copy number was calculated using standard curves generated from pGEM-5317. Briefly, DNA template was serially diluted 10-fold such that 5 μl contained from 103 to 1011 copies of LAT then subjected to TaqMan PCR with the same set of primers. The copy number for each reaction was determined by comparing the normalized threshold cycle of each sample to the threshold cycle of the standard. GAPDH expression was used to normalize the relative expression of LAT RNA in the TG. Latency is based on 20 TG per each group of mice. p-values were determined using one-way ANOVA. (B) Explant reactivation in TG from latently infected mice. TG from latently infected mice were individually isolated on day 28 PI. Each individual TG was incubated in 1.5 ml of tissue culture media at 37°C. Media aliquots were removed from each culture daily for up to 5 days and plated on indicator cells (RS cells) to assess the appearance of reactivated virus. Results are plotted as the number of TG that reactivated daily. Numbers indicate the average time that the TG from each group first showed CPE ± SEM. Reactivation is based on 20 TG from ten mice per group. p-values were determined using one-way ANOVA. Panels: A) LAT copy number; and B) Reactivation.

