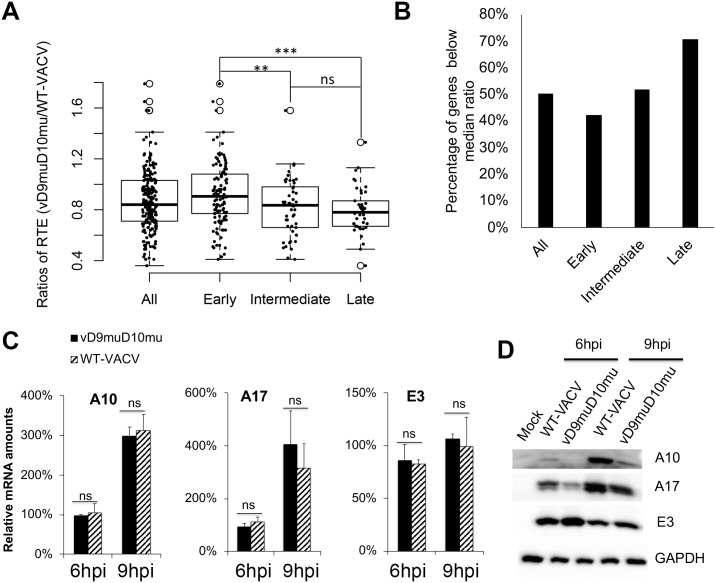
Fig 2. Translation of VACV early and late mRNAs is differentially affected by D9 and D10 inactivation during VACV infection.
(A) Strip plot comparison of ribosome/non-ribosome-binding RNA ratios of early, intermediate, and late viral mRNAs in WT and vD9muD10mu-infected A549DKO cells. Solid dots represent the values of individual genes, which are overlaid on top of the corresponding whisker plot. ***<0.0001. (B) Percentages of genes below the median ratio of WT- to vD9muD10mu-infected A549DKO cells for early, intermediate, and late mRNA translation efficiency. (CD) mRNA (C) and protein levels (D) for E3, A10, A17 in WT-VACV- and vD9muD10mu-infected A549 DKO cells. The mRNA levels were determined by qRT-PCR and the protein levels were determined by Western Blotting analysis. ** indicates p ≤ 0.01, *** indicates p ≤ 0.001, ns indicates not significant.

