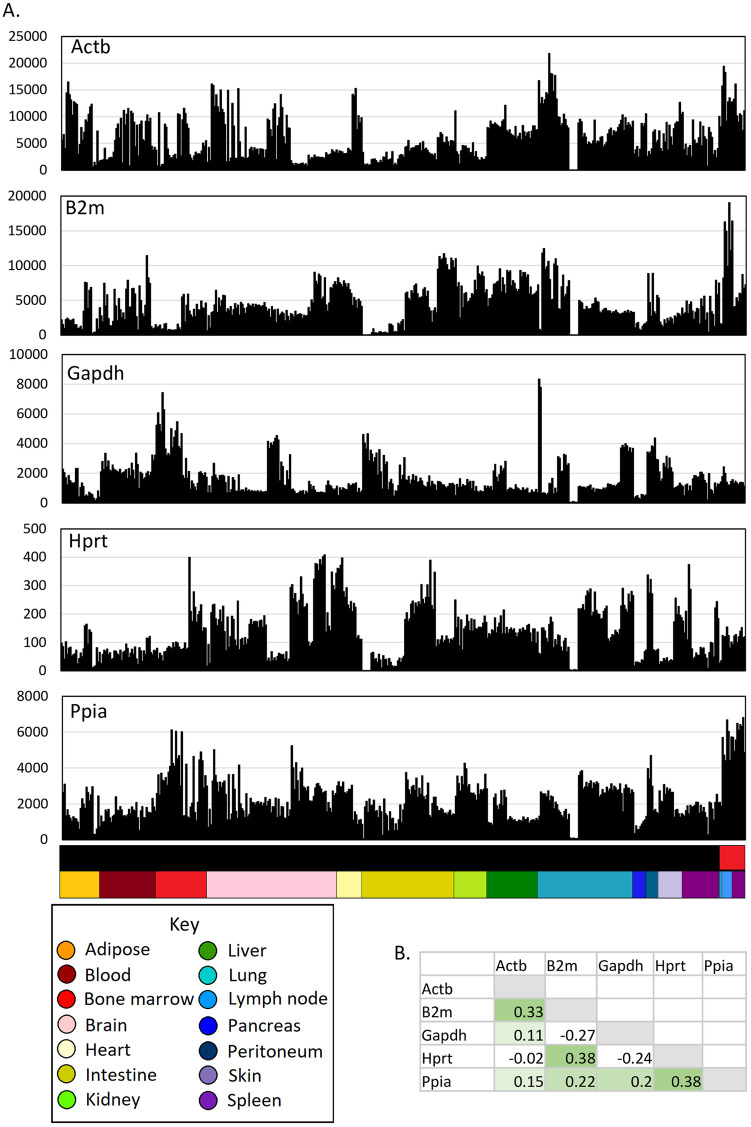
Fig 1. Expression of housekeeping genes across MPS cell populations.
The data underlying this Figure can be found in S1 Data. (A) Expression patterns across cells from different tissues. Each column represents a sample. Upper bar along the X axis shows the cell type (black—monocytes and macrophages; red—DCs). Lower bar shows the tissue, coloured as shown in the key. Y axis shows expression level in TPM, calculated using Kallisto. (B) Correlations (Pearson correlation coefficient) between expression patterns of different housekeeping genes. DC, dendritic cell; MPS, mononuclear phagocyte system; TPM, transcripts per million.

