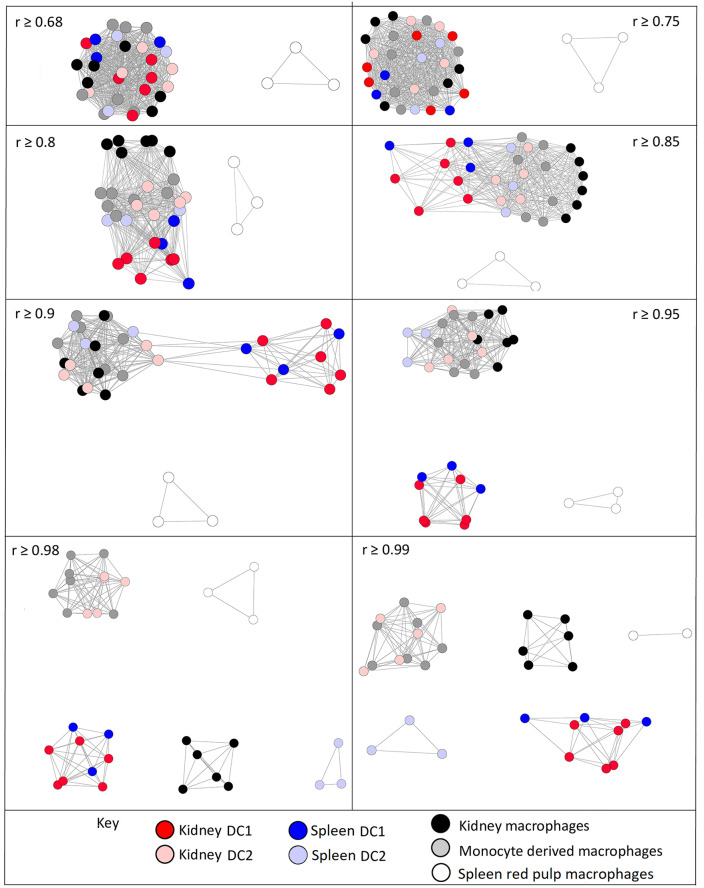
Fig 8. Sample-to-sample 2D network analysis of gene expression in macrophage and DC subpopulations from kidney and spleen.
The sample-to-sample network was generated by BioLayout analysis at the indicated Pearson r values, which all included all 33 samples up to r ≥ 0.98. Above r ≥ 0.98, 1 red pulp macrophage sample was lost. Red, kidney DC1; pink, kidney DC2; dark blue, spleen DC1; light blue, spleen DC2; black, kidney macrophages; grey, monocyte-derived macrophages; white, spleen red pulp macrophages. Lists of genes and expression profiles of clusters are presented in S4 Data. DC, dendritic cell.

