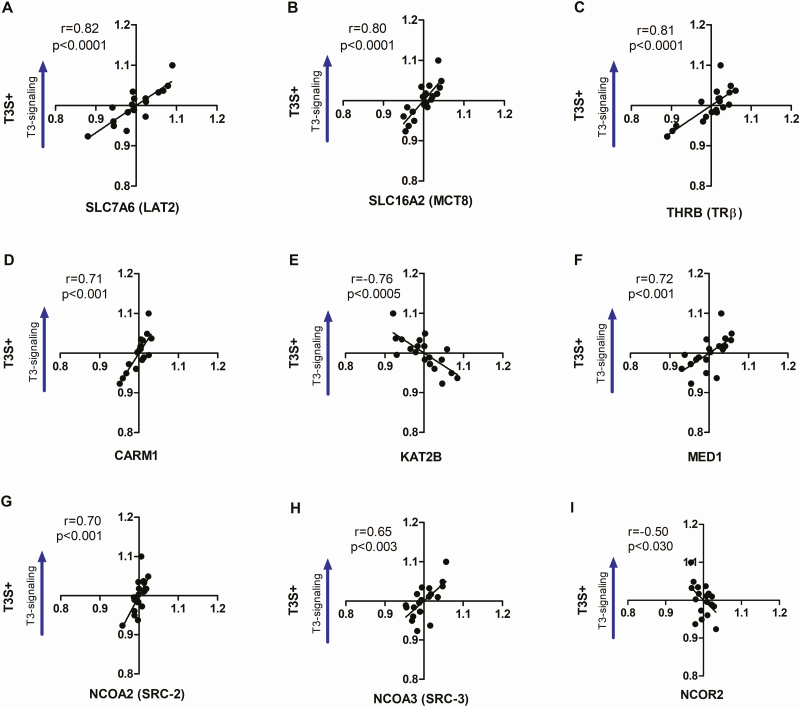
Figure 2.
Correlation analysis between T3S+ and the components included at the Factors 1 and 2 that reached statistical significance in Factor Analysis. TH transporters LAT2 (A), MCT8 (B), TH receptor TRβ (C), coactivators CARM1 (D), KAT2B (E), MED1 (F), SRC-2 (G), and SRC-3 (H), and corepressor NCOR2 (I). Statistical significance is shown in each graph as well as Spearman’s correlation coefficient (r).

