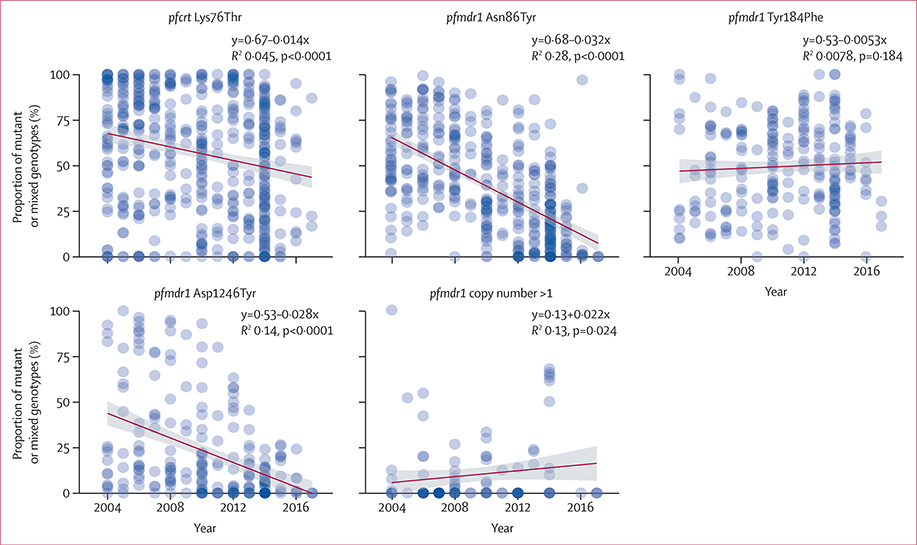
Figure 4: Trends in molecular markers.
Shown is the proportion of mutant or mixed genotypes, where applicable, of the total number of samples for each survey (blue points) and best-fit lines (dark red) with standard error bounds (grey). Nonlinear trends are shown in appendix 1 (pp 3, 6).

