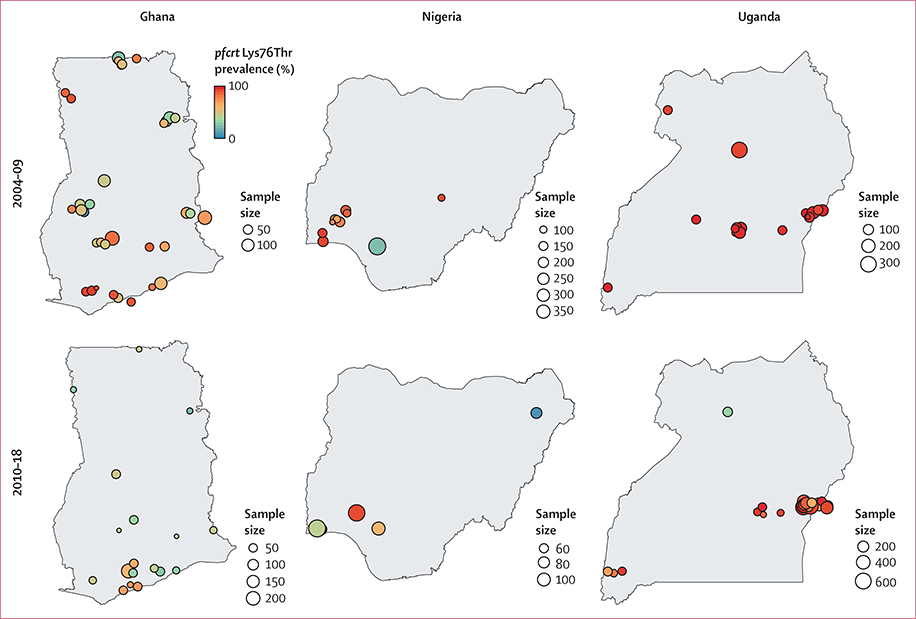
Figure 5: Prevalence of pfcrt Lys76Thre markers.
Shown is the prevalence in Ghana, Nigeria, and Uganda for 2004–09 and 2010–18. Circle size is proportional to sample size and the colour corresponds to the prevalence of mixed or mutant genotypes. Circles are jittered for visualisation to account for overlapping survey sites. The median sample size for Ghana was 49 (IQR 38–56), Nigeria 81 (70–104), and Uganda 104 (78–216).

