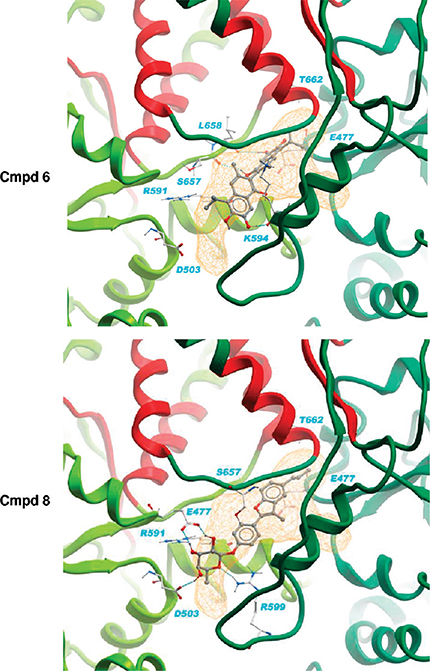
Figure 5.
Binding of new hits (compounds 6 and 8) into the Hsp90 dimer. Lowest binding energies were obtained with a MD representative conformation (cluster 2, time = 65 200 ps). The protein complex is shown in a ribbon representation colored by a chain with the putative communication hot spot residues colored in red. The Hsp90 C-terminal binding pocket (pocket A) is shown as an orange line mesh and protein–ligand hydrogen bonds are represented with spheres.

