Figure 3.

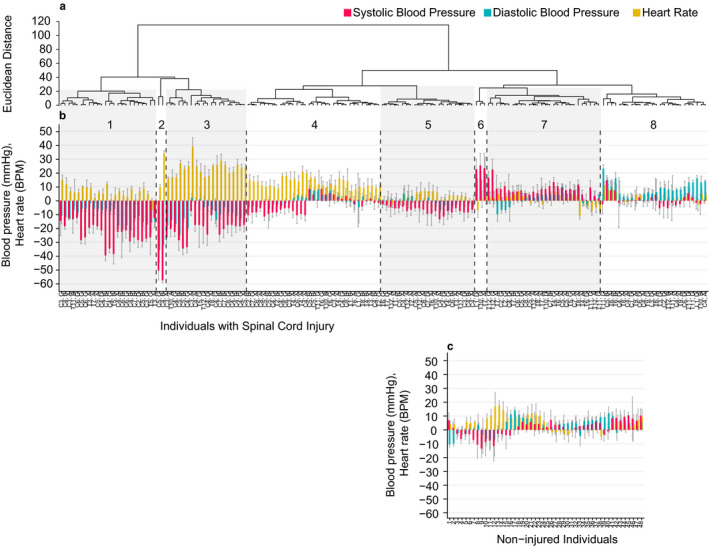
Hierarchical cluster analysis based on change in systolic blood pressure, diastolic blood pressure, and heart rate upon assumption of an upright position. Dendrogram of individuals with SCI (Panel a) is ordered with similar hemodynamic responses having the least Euclidean distance between them. Difference (1‐minute mean ± SD) in systolic blood pressure (mmHg, red vertical bars), diastolic blood pressure (mmHg, green vertical bars), and heart rate (BPM, yellow vertical bars) upon assumption of an upright position were shown for each individual (Panels b and c). Vertical dashed lines delineate between clusters which are denoted as numbers on the top, with injury levels and severities denoted on the x‐axis (Panel b). Each non‐injured individual is denoted on the x‐axis (Panel c)
