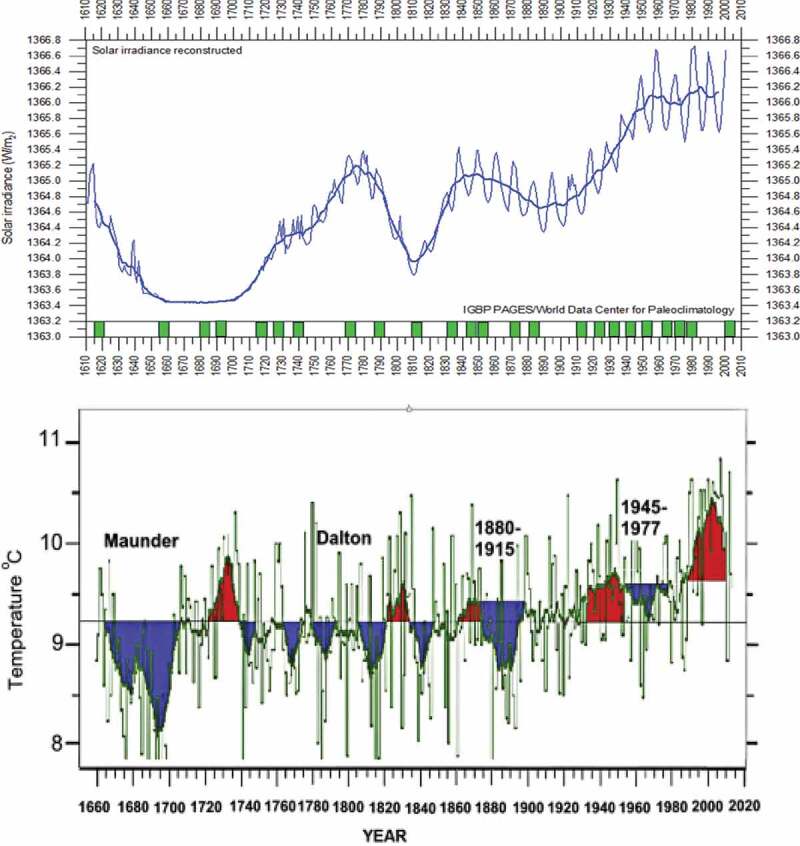
Figure 4.

Top plot: restored total solar irradiance from 1600 until 2014 by Lean et al. [2]. Modified by Easterbrook [3], from Lean, Beer, Bradley [2]. Bottom plot: Central England temperatures (CET) recorded continuously since 1658. Blue areas are reoccurring cool periods; red areas are warm periods. All times of solar minima were coincident with cool periods in central England. Adopted from Easterbrook [3], with the Elsevier publisher permissions.
