
Fig. 7.
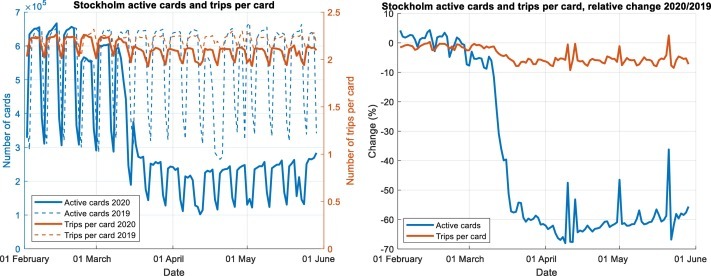
Stockholm, daily number of active cards and daily average number of trips per active card, in absolute numbers (left) and relative to the baseline (right). Bus trips are excluded.
Official websites use .gov
A
.gov website belongs to an official
government organization in the United States.
Secure .gov websites use HTTPS
A lock (
) or https:// means you've safely
connected to the .gov website. Share sensitive
information only on official, secure websites.
Stockholm, daily number of active cards and daily average number of trips per active card, in absolute numbers (left) and relative to the baseline (right). Bus trips are excluded.