

Abstract
Background
We analyzed a population-based national registry to identify the most influential patient pretreatment and treatment factors affecting overall survival (OS) and cause-specific survival (CSS) in patients diagnosed with acinic cell carcinoma (ACC) of the major salivary glands.
Methods
Using the Surveillance, Epidemiology, and End Results (SEER) database of the US National Cancer Institute (NCI) related to survival, a total of 1,254 patients with diagnosed ACC of the major salivary glands from 1975 to 2016 met inclusion criteria. Factors significant for OS and CSS were determined using univariate and multivariate analysis with the Cox proportional hazards model.
Results
Univariate OS analysis demonstrated that surgery favorably influenced longer survival compared to no surgery (hazard ratio (HR) 2.35, P < 0.05). Patient age was found to be highly predictive of superior OS (divided into 10-year age bands, P < 0.0001, younger age better). In multivariate OS analysis, there were statistically significant worse outcomes for men (HR 1.54, P < 0.05), grades III/IV (HR 2.5, P < 0.05), and distant disease (HR 3.55, P < 0.05) or regional disease (HR 1.22, P < 0.05). Patients diagnosed during years 1996 - 2016 had better OS when compared to earlier decades 1975 - 1995 (HR 1.38, P < 0.05). In univariate analysis, the mean CSS for grades I, II, and III/IV were 429 months (95% confidence interval (CI), ± 38.39), 426 months (95% CI, ± 25.73) and 198 months (95% CI, ± 66.38). Multivariate analysis of CSS further demonstrated that there were statistically significant worse outcomes for men (HR 1.68, P < 0.05), grade III/IV (HR 3.2, P < 0.05), tumor size greater than 40 mm (P < 0.001), and distant disease (HR 4.48, P < 0.05) or regional disease (HR 1.84, P < 0.05).
Conclusions
To our knowledge, this is the largest population-based study of OS and CSS of major salivary gland ACC. We found that the patient pretreatment and treatment factors including younger age at diagnosis, female sex, early stage, lower grade, surgical excision, and recent year of diagnosis are associated with improved survival in patients diagnosed with ACC of the major salivary glands. We hope that this information will aid in construction of further research projects that better refine optimal treatment protocol of individualized patient care.
Keywords: Cancer, Head and neck, Salivary gland, Surgery, Radiation
Introduction
Salivary gland malignancies constitute approximately 0.6% of all malignancies. Acinic cell carcinoma (ACC), first reported in the literature by Godwin et al in 1954, is a low-grade malignancy that accounts for about 7% of salivary gland neoplasms and is one of the most common salivary gland malignancies (17%) [1-5]. Women are more commonly diagnosed than men but have a better prognosis. ACC patients are usually diagnosed early (age 51 mean) than those with other salivary gland tumors and a handful of patients are diagnosed younger than age 30. The younger diagnosed patients are generally found to have a better prognosis. There are no reported ethnic or racial associations with ACC [2, 3, 6]. The parotid gland is the most frequent site of origin (83.3%) and the most common presentation is a gradually growing mass in the tail of the parotid gland [7-9]. A total of 11% of ACCs are located in the submandibular gland, 3-12% in the minor salivary glands, and less than 1% in the sublingual gland [8, 9].
Several studies report previous radiation exposure and familial predisposition as risk factors for ACC [7, 10, 11]. Other risks for developing salivary malignancies and ACC include industrial workers exposed to asbestos, rubber manufacturing, metal, nickel compounds, and woodworking, as well as employment in hairdressing and beauty shops [7].
Fine needle aspiration biopsy is often used to confirm the diagnosis [7]. Most patients first diagnosed with ACC have noticed a growth within the past year, but about 7% of patients wait for 5 - 10 years before talking to their physician [12].
The gold standard of care is total or subtotal surgical excision. Adjuvant radiation therapy depends on the case and is especially used for recurrent ACC, positive margins, advanced ACC with cervical lymph node metastasis, and incomplete total removal of a tumor [5-7]. Some studies are exploring fast neutron beam radiation as an adjunct or replacement to surgery as a first-line treatment, especially for inoperable tumors or recurrences, for strong long-term local control of the disease. ACC is generally thought to be chemoresistant due to its slow metabolism. Some cases have reported chemotherapy to be useful for some pain relief but mostly ineffective [8, 13].
Long-term follow-up is recommended for all ACC patients, because although it usually shows low-grade behavior, the World Health Organization re-classified ACC as a “malignant carcinoma” due to its high recurrence and metastasis rate [7, 13]. Several studies report the recurrence rate to be around 35% and local recurrence has been reported in many instances up to 30 years after diagnosis. Metastases tend to occur in the cervical lymph nodes and lung, though other reported locations include the cavernous sinus, spine, sternum, orbit, liver, and skin [7, 8, 13].
There have been many predictive factors reported in the literature for ACC, including some factors associated with poorer prognosis such as histologic grade, metastasis at presentation, male sex, and patients diagnosed at older age [6, 14].
We are presenting a multivariate analysis and review of the literature of ACC for the major salivary gland sites (submandibular and parotid) with subgroup analysis of effect of age (10-year bands), decade of diagnosis (10-year vs. 20-year bands), surgery +/- radiation, surgery type, race, male versus female, stage excluding metastatic disease or patients with M1 disease from the entire analysis, and dose of radiation.
Materials and Methods
All data were acquired from the 1973 - 2016 database of the Surveillance, Epidemiology, and End Results (SEER) Program of the US National Cancer Institute (NCI). The SEER database contains data from geographically specified US locations that spans a population of approximately 30 million people. Registry data are submitted without personal identifiers; therefore, patients’ informed consent and ethics committee approval were not required to perform this analysis. The primary endpoints were overall survival (OS) and cause-specific survival (CSS). For this analysis we examined 1,254 patients with a diagnosis of cancer of the major salivary glands and primary tumor histology of acinar cell neoplasms. As for the inclusion criteria, we included patients in our study in the SEER database from 1973 to 2016. The patients were grouped by age at diagnosis, tumor stage, tumor size, tumor grade, patient race, patient gender, whether the patient received radiation, whether the patient received surgery, and diagnosis year.
Survival curves were estimated using the Kaplan-Meier method and used to compare treatment groups, age groups, Karnofsky performance status (KPS) groups, primary tumor histology groups, brain metastases number groups, and tumor volume groups. The 95% confidence intervals (CIs) for the median survival time of the groups were constructed. Approximate confidence intervals for the log hazard ratio were calculated using the estimate of standard error (se):
where ei is the extent of exposure to risk of death for group i of k at the jth distinct observed time for group i of k (Armitage P, Berry G. Statistical Methods in Medical Research (third edition), Blackwell, 1994). Log-rank tests were employed to determine if there is statistical evidence of differences between the survival curves of the groups. Finally, the Cox proportional hazards model was used in a multivariate analysis of the treatment groups, age groups, KPS groups, and primary tumor histology groups. All statistical analyses utilized StatsDirect Version 3.2.8 (StatsDirect Ltd., Altrincham, UK) and SigmaPlot Version 12.3 (SYSTAT Software, Inc., San Jose, CA, USA).
The Institutional Review Board (IRB) of Spokane stated that this project was exempt from IRB approval as it is a retrospective project utilizing a national database with already de-identified cancer information and this study does not report on individual geographic locations or on individual patients.
Results
We identified 1,254 patients diagnosed with ACC of the major salivary glands in the SEER database meeting our inclusion criteria. The most common patient ages of diagnosis were ages 40 to 69, and there was a slight prevalence of occurrence in female versus male patients (750/1,254). While 97% of the reported patients underwent surgery, only 35% received adjuvant radiotherapy.
In univariate and multivariate analysis of OS and CSS, we found statistically significant favorable outcomes in younger aged patients, tumor sizes smaller than 40 mm, localized disease stage rather than regional or distant, tumor grades I/II compared to III/IV, and treatment with surgery compared to no surgery. We did not find any racial associations of ACC of the major salivary glands.
Univariate OS analysis (Table 1) demonstrated that surgery favorably influenced longer survival compared to no surgery (HR 2.35, P < 0.05). Patient age was found to be highly predictive of superior OS (divided into 10-year age bands, P < 0.0001, younger age better) (Fig. 1). As expected, diagnosis year before 1996 decreased favorable outcome with a hazard ratio of 1.36 (P < 0.05).
Table 1. Overall Survival Analysis of Acinar Cell Neoplasms of the Major Salivary Glands.
| N | Median survival |
Univariate |
Multivariate |
|||||
|---|---|---|---|---|---|---|---|---|
| Hazard ratio |
Hazard ratio |
|||||||
| 95% CI | Estimate | 95% CI | P value | Estimate | 95% CI | P value | ||
| Age bands | ||||||||
| 00 - 09 | 5 | Cannot estimate | Cannot estimate | Cannot estimate | ||||
| 10 - 19 | 85 | Cannot estimate | 0.11 | 0.01 - 0.44 | < 0.0001 | 0.11 | 0.04 - 0.3 | < 0.001 |
| 20 - 29 | 138 | Cannot estimate | 0.22 | 0.08 - 0.52 | < 0.0001 | 0.21 | 0.14 - 0.33 | < 0.001 |
| 30 - 39 | 172 | Cannot estimate | 0.6 | 0.34 - 1.04 | 0.0729 | 0.61 | 0.56 - 0.67 | < 0.001 |
| 40 - 49a | 228 | 417 ± 28.25 | Reference | Reference | ||||
| 50 - 59 | 218 | 403 ± 101.24 | 1.72 | 1.13 - 2.63 | 0.0085 | 1.72 | 1.64 - 1.8 | < 0.001 |
| 60 - 69 | 203 | 219 ± 20.67 | 4.36 | 2.90 - 6.69 | < 0.0001 | 4.54 | 4.16 - 4.97 | < 0.001 |
| 70 - 79 | 136 | 128 ± 17.12 | 8.67 | 5.64 - 13.63 | < 0.0001 | 9.42 | 8.54 - 10.41 | < 0.001 |
| 80 + | 69 | 403 ± 101.24 | 18.04 | 10.52 - 31.84 | < 0.0001 | 21.05 | 13.11 - 33.85 | < 0.001 |
| Stage | ||||||||
| Localizeda | 947 | 391 ± 35.25 | Reference | Reference | ||||
| Regional | 196 | 258 ± 67.97 | 2.11 | 1.64 - 2.69 | < 0.0001 | 1.22 | 1.19 - 1.25 | < 0.001 |
| Distant | 39 | 83 ± 41.85 | 7.79 | 4.70 - 12.38 | < 0.0001 | 3.55 | 3.06 - 4.12 | < 0.001 |
| Unknown | 72 | 270 ± 37.2 | 1.64 | 0.94 - 2.68 | 0.0583 | 0.87 | 0.48 - 1.58 | 0.64 |
| Primary tumor size (mm) | ||||||||
| 0 - 10a | 92 | Cannot estimate | Reference | Reference | ||||
| 11 - 20 | 370 | Cannot estimate | 1.57 | 0.80 - 3.45 | 0.2378 | 1.35 | 1.06 - 1.71 | 0.02 |
| 21 - 30 | 270 | 330 ± 88.55 | 2.85 | 1.46 - 6.21 | 0.0007 | 1.57 | 1.21 - 2.02 | < 0.001 |
| 31 - 40 | 109 | Cannot estimate | 2.81 | 1.31 - 6.55 | 0.0041 | 1.02 | 0.85 - 1.22 | 0.83 |
| 41 - 50 | 42 | 180 ± 114.72 | 5.79 | 2.42 - 14.54 | < 0.0001 | 7.4 | 6.71 - 8.18 | < 0.001 |
| > 50 | 46 | Cannot estimate | 6.74 | 2.85 - 16.85 | < 0.0001 | 2.78 | 1.24 - 6.25 | 0.01 |
| Unknown/unspecific | 325 | 330 ± 49.63 | 2.59 | 1.36 - 5.54 | 0.0018 | 1.54 | 1.2 - 1.98 | < 0.001 |
| Grade | ||||||||
| Ia | 197 | 393 ± 77.06 | Reference | Reference | ||||
| II | 164 | Cannot estimate | 1.04 | 0.64 - 1.67 | 0.9076 | 1.01 | 0.96 - 1.05 | 0.76 |
| III/IV | 55 | 48 ± 22.99 | 5.28 | 3.23 - 8.58 | < 0.0001 | 2.5 | 2.32 - 2.7 | < 0.001 |
| Unknown | 838 | 375 ± 36.82 | 1.14 | 0.82 - 1.61 | 0.4775 | 1.21 | 0.86 - 1.69 | 0.27 |
| Race | ||||||||
| American Indian/Alaska Native | 5 | Cannot estimate | 1.73 | 0.21 - 6.33 | 0.3238 | 9.47 | 2.20 - 40.73 | 0.003 |
| Asian or Pacific Islander | 97 | Cannot estimate | 0.57 | 0.32 - 0.94 | 0.0266 | 0.78 | 0.46 - 1.30 | 0.336 |
| Black | 96 | 379 ± 80.34 | 0.78 | 0.48 - 1.21 | 0.319 | 1.48 | 0.93 - 2.34 | 0.098 |
| Unknown | 14 | Cannot estimate | 0.22 | 0.01 - 1.25 | 0.1425 | 1.07 | 0.14 - 8.05 | 0.949 |
| Whitea | 1,042 | 335 ± 39.77 | Reference | Reference | ||||
| Sex | ||||||||
| Femalea | 750 | 372 ± 35.5 | Reference | Reference | ||||
| Male | 504 | 351 ± 79.47 | 1.23 | 0.99 - 1.52 | 0.0544 | 1.54 | 1.24 - 1.90 | < 0.001 |
| Radiation | ||||||||
| No/unknown | 810 | 391 ± 23.66 | 0.54 | 0.44 - 0.67 | < 0.0001 | 0.36 | 0.16 - 0.83 | 0.016 |
| Yesa | 444 | 258 ± 37.77 | Reference | Reference | ||||
| Sequence | ||||||||
| Not applicablea | 819 | 389 ± 31.43 | Reference | Reference | ||||
| Radiation after surgery | 422 | 265 ± 36.43 | 1.74 | 1.39 - 2.17 | < 0.0001 | 0.52 | 0.23 - 1.20 | 0.125 |
| Radiation before surgery | 13 | Cannot estimate | 1.66 | 0.66 - 3.48 | 0.2111 | 0.67 | 0.22 - 2.04 | 0.475 |
| Surgery | ||||||||
| No | 30 | Cannot estimate | 2.35 | 1.16 - 4.28 | 0.0095 | 1.66 | 0.79 - 3.49 | 0.18 |
| Unknown | 5 | 144 ± 227.59 | 2.35 | 0.75 - 5.58 | 0.0676 | 2.83 | 1.76 - 4.54 | < 0.001 |
| Yesa | 1,219 | 372 ± 36.77 | Reference | Reference | ||||
| Diagnosis year | ||||||||
| 1975 - 1995 | 461 | 330 ± 41.09 | 1.36 | 1.06 - 1.74 | 0.0129 | 1.38 | 1.04 - 1.83 | 0.028 |
| 1996 - 2016a | 793 | Cannot estimate | Reference | Reference | ||||
| Surgery type | ||||||||
| Excisiona | 1,204 | 372 ± 36.48 | Reference | Variable not used in multivariate analysis | ||||
| Limited surgical procedure/biopsy | 15 | 58 ± 17.67 | 3.51 | 1.17 - 10.54 | 0.0005 | |||
| None | 30 | Cannot estimate | 2.43 | 1.20 - 4.43 | 0.0076 | |||
| Unknown | 5 | 144 ± 227.59 | 2.38 | 0.76 - 5.67 | 0.0643 | |||
| Diagnosis year | ||||||||
| 1975 - 1984 | 157 | 351 ± 64 | 1.25 | 0.74 - 2.09 | 0.3781 | Variable not used in multivariate analysis | ||
| 1985 - 1994 | 264 | 319 ± 42.61 | 1.89 | 1.24 - 2.90 | 0.0021 | |||
| 1995 - 2004 | 356 | Cannot estimate | 1.32 | 0.87 - 2.02 | 0.1972 | |||
| 2005 - 2016a | 477 | Cannot estimate | Reference | |||||
“Cannot estimate” means statistically a numeric variable is not able to be calculated. aIndicates reference group. CI: confidence interval.
Figure 1.
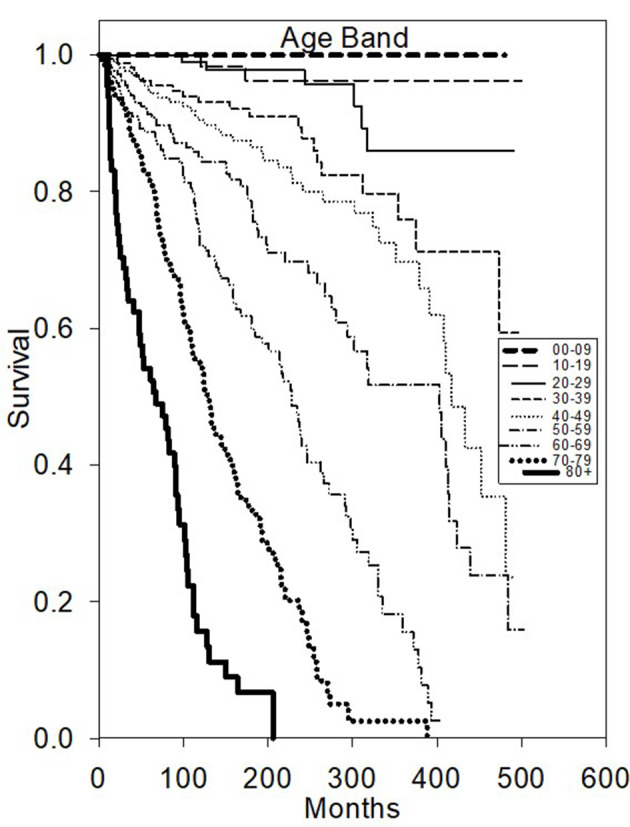
Kaplan-Meier survival plot of overall survival based on age diagnosed.
Multivariate OS analysis (Table 1) confirmed that there were statistically significant worse outcomes for men (HR 1.54, P < 0.05), grades III/IV (HR 2.5, P < 0.05), and distant disease (HR 3.55, P < 0.05) or regional disease (HR 1.22, P < 0.05). Patients diagnosed during years 1996 - 2016 had better OS when compared to earlier decades 1975 - 1995 (HR 1.38, P < 0.05). Both univariate and multivariate analysis of OS did not reveal adjuvant radiotherapy to be associated with improved outcome when compared to surgery alone.
Table 2 illustrates that the mean univariate analysis for CSS for grades I, II, and III/IV were 429 months (95% CI, ± 38.39), 426 months (95% CI, ± 25.73) and 198 months (95% CI, ± 66.38), respectively. Patient age younger than 50 was found to be highly predictive of superior OS rates (P < 0.05). Male sex was again a slightly worse prognostic factor (HR 1.58, P < 0.05) as well as tumor size greater than 40 mm (P < 0.001) and surgery favorably influenced survival compared to no surgery (HR 2.74, P < 0.05).
Table 2. Cause-Specific Survival Analysis of Acinar Cell Neoplasms of the Major Salivary Glands.
| N | Median survival |
Univariate |
Multivariate |
|||||
|---|---|---|---|---|---|---|---|---|
| Hazard ratio |
Hazard ratio |
|||||||
| 95% CI | Estimate | 95% CI | P value | Estimate | 95% CI | P value | ||
| Age bands | ||||||||
| 00 - 09 | 5 | Cannot estimate | Cannot estimate | Cannot estimate | ||||
| 10 - 19 | 85 | Cannot estimate | 0 | 0.00 - 0.44 | 0.0011 | Cannot estimate | ||
| 20 - 29 | 138 | Cannot estimate | 0.14 | 0.02 - 0.58 | 0.0012 | Cannot estimate | ||
| 30 - 39 | 172 | Cannot estimate | 0.4 | 0.14 - 0.98 | 0.0356 | Cannot estimate | ||
| 40 - 49a | 228 | Cannot estimate | Reference | Reference | ||||
| 50 - 59 | 218 | Cannot estimate | 1.16 | 0.60 - 2.23 | 0.6457 | Cannot estimate | ||
| 60 - 69 | 203 | Cannot estimate | 2.04 | 1.11 - 3.85 | 0.0197 | Cannot estimate | ||
| 70 - 79 | 136 | Cannot estimate | 2.05 | 1.01 - 4.18 | 0.0326 | Cannot estimate | ||
| 80 + | 69 | Cannot estimate | 8.47 | 4.19-17.50 | < 0.0001 | Cannot estimate | ||
| Stage | ||||||||
| Localizeda | 947 | Cannot estimate | Reference | Reference | ||||
| Regional | 196 | Cannot estimate | 4.11 | 2.73 - 6.17 | < 0.0001 | 1.84 | 1.18 - 2.86 | 0.007 |
| Distant | 39 | Cannot estimate | 13.84 | 6.73 - 26.73 | < 0.0001 | 4.48 | 2.24 - 8.96 | < 0.001 |
| Unknown | 72 | Cannot estimate | 2.07 | 0.65 - 5.11 | 0.1078 | 1.17 | 0.42 - 3.30 | 0.762 |
| Primary tumor size (mm) | ||||||||
| 0 - 10a | 92 | Cannot estimate | Reference | Reference | ||||
| 11 - 20 | 370 | Cannot estimate | 2.05 | 0.48 - 18.43 | 0.5565 | 1.46 | 0.65 - 3.26 | 0.36 |
| 21 - 30 | 270 | Cannot estimate | 4.85 | 1.20 - 42.39 | 0.0157 | 2 | 0.46 - 8.65 | 0.35 |
| 31 - 40 | 109 | Cannot estimate | 2.81 | 1.31 - 6.55 | 0.0041 | 1.25 | 0.64 - 2.47 | 0.51 |
| 41 - 50 | 42 | Cannot estimate | 15.99 | 3.37 - 151.34 | < 0.0001 | 11.52 | 5.91 - 22.44 | < 0.001 |
| > 50 | 46 | Cannot estimate | 14.79 | 2.86 - 146.58 | 0.0002 | 3.84 | 2.06 - 7.17 | < 0.001 |
| Unknown/unspecific | 325 | Cannot estimate | 5.38 | 1.41 - 45.81 | 0.0051 | 2.76 | 1.12 - 6.83 | 0.03 |
| Grade | ||||||||
| Ia | 197 | Cannot estimate | Reference | Reference | ||||
| II | 164 | Cannot estimate | 0.79 | 0.31 - 1.93 | 0.6817 | 0.96 | 0.41 - 2.28 | 0.93 |
| III/IV | 55 | 280 ± 339.83 | 8.36 | 4.10 - 17.49 | < 0.0001 | 3.2 | 3.16 - 3.24 | < 0.001 |
| Unknown | 838 | Cannot estimate | 1.04 | 0.59 - 1.94 | > 0.9999 | 1.08 | 0.94 - 1.25 | 0.29 |
| Race | ||||||||
| American Indian/Alaska Native | 5 | Cannot estimate | 4.59 | 0.55 - 17.08 | 0.0732 | 24.75 | 4.82 - 127.19 | < 0.001 |
| Asian or Pacific Islander | 97 | Cannot estimate | 0.4 | 0.11 - 1.06 | 0.0849 | 0.66 | 0.24 - 1.82 | 0.417 |
| Black | 96 | Cannot estimate | 0.6 | 0.22 - 1.35 | 0.3097 | 0.91 | 0.38 - 2.18 | 0.826 |
| Unknown | 14 | Cannot estimate | 0.7 | 0.02 - 3.98 | > 0.9999 | 1.62 | 0.17 - 15.75 | 0.676 |
| Whitea | 1,042 | Cannot estimate | Reference | Reference | ||||
| Sex | ||||||||
| Femalea | 750 | Cannot estimate | Reference | Reference | ||||
| Male | 504 | Cannot estimate | 1.58 | 1.09 - 2.29 | 0.0123 | 1.68 | 1.15 - 2.43 | 0.007 |
| Radiation | ||||||||
| No/unknown | 810 | Cannot estimate | 0.29 | 0.20 - 0.42 | < 0.0001 | 0.78 | 0.49 - 1.25 | 0.31 |
| Yesa | 444 | Cannot estimate | Reference | Reference | ||||
| Sequence | ||||||||
| Not applicablea | 819 | Cannot estimate | Reference | Reference | ||||
| Radiation after surgery | 422 | Cannot estimate | 1.74 | 1.39 - 2.17 | < 0.0001 | 0.46 | 0.15 - 1.37 | 0.163 |
| Radiation before surgery | 13 | Cannot estimate | 3.1 | 0.62 - 9.62 | 0.0797 | 0.62 | 0.13 - 3.07 | 0.558 |
| Surgery | ||||||||
| No | 30 | Cannot estimate | 2.74 | 0.87 - 6.60 | 0.0413 | 1.46 | 0.48 - 4.52 | 0.507 |
| Unknown | 5 | Cannot estimate | 3.69 | 0.44 - 13.81 | 0.1058 | 2.98 | 0.56 - 15.96 | 0.202 |
| Yesa | 1,219 | Cannot estimate | Reference | Reference | ||||
| Diagnosis year | ||||||||
| 1975 - 1995 | 461 | Cannot estimate | 1.32 | 0.88 - 1.97 | 0.1712 | 1.28 | 0.80 - 2.04 | 0.305 |
| 1996 - 2016a | 793 | Cannot estimate | Reference | Reference | ||||
| Surgery type | ||||||||
| Excisiona | 1,204 | Cannot estimate | Reference | Variable not used in multivariate analysis | ||||
| Limited surgical procedure/biopsy | 15 | Cannot estimate | 4.8 | 1.52 - 11.60 | 0.0048 | |||
| None | 30 | Cannot estimate | 2.86 | 0.91 - 6.92 | 0.0352 | |||
| Unknown | 5 | Cannot estimate | 3.79 | 0.45 - 14.17 | 0.1018 | |||
| Diagnosis year | ||||||||
| 1975 - 1984 | 157 | Cannot estimate | 1.75 | 0.85 - 3.59 | 0.1112 | Variable not used in multivariate analysis | ||
| 1985 - 1994 | 264 | Cannot estimate | 1.66 | 0.87 - 3.22 | 0.1248 | |||
| 1995 - 2004 | 356 | Cannot estimate | 1.44 | 0.78 - 2.72 | 0.2512 | |||
| 2005 - 2016a | 477 | Cannot estimate | Reference | |||||
“Cannot estimate” means statistically a numeric variable is not able to be calculated. aIndicates reference group. CI: confidence interval.
Multivariate analysis of CSS (Table 2) further demonstrated that there were statistically significant worse outcomes for men (HR 1.68, P < 0.05), grade III/IV (HR 3.2, P < 0.05), and distant disease (HR 4.48, P < 0.05) or regional disease (HR 1.84, P < 0.05) (Fig. 2). Tumor size greater than 40 mm was statistically significant for worse outcomes (P < 0.001) (Fig. 3).
Figure 2.
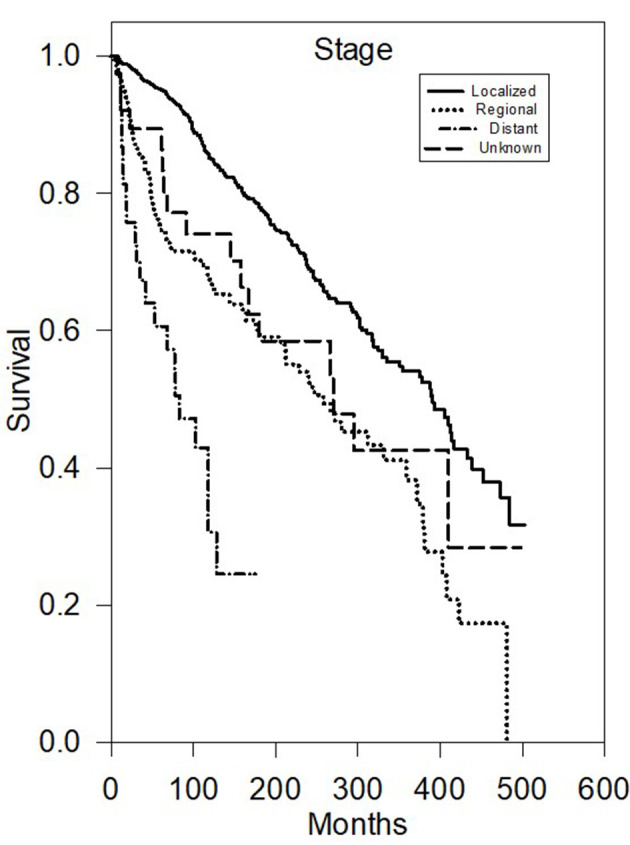
Kaplan-Meier survival plot of cause-specific survival based on stage.
Figure 3.

Kaplan-Meier survival plot of cause-specific survival based on primary tumor size.
Discussion
ACC has an overall good prognosis from time of diagnosis, with around 90% 5-year survival and around 50% 20-year survival [15]. From our multivariate analysis of the SEER database of 1,254 reported patients, we found that age less than 50 years old, female gender, early stage, lower grade, complete surgical resection with negative margins, and recent diagnosis year are associated with better prognosis.
A review of the literature shows age 50 as the mean age of diagnosis, younger than most other salivary cancers. A total of 16% of patients are reported to be under age 30 when diagnosed and have a lower prevalence of metastasis, high grading, and larger tumor size, all leading to a better prognosis [2, 3, 6]. A study by Wahlberg et al reports that ACC patients < 50 years old had a better prognosis than ACC patients between the ages of 50 and 74, which our study also supports with statistical significance [14]. While most studies show that younger age at presentation predicts better prognosis, our study is unique because we highlight the importance of age in 10-year increments, making a continuous variable.
According to the US National Cancer Data Base Report, women are more commonly diagnosed with ACC than men (58.8% and 41.2%, respectively), and women further predominated the younger patients who were diagnosed under the age of 30 (64.4%) [2, 3, 5]. Biron et al reported 59.5% incidence in women and 40.5% in men, as well as a better prognosis for women with a multivariate analysis ratio of 0.71 when compared to men [6]. Our study showed a similar pattern with a slight prevalence of occurrence in female versus male patients (750/1,254) and statistically significant worse outcomes for men (HR 1.54 - 1.68, P < 0.05) in both OS and CSS.
There are no reported ethnic or racial associations with ACC [2, 3, 6]. Our analysis also did not show any statistically significant differences according to race.
Because ACC is a slow growing malignancy, most presenting ACC tumors are of lower stage. A study from 2019 with 1,509 ACC patients reports that over 40% presented at stage I, 30-35% presented at stage II, 15% presented as stage III, and 11% presented as stage IV. This downward trend is especially noticeable when compared to other histological subtypes, as ACC had the lowest percentage of presenting stage IV compared to all other histological subtypes [5]. In our study, we classified stage as local (N0M0), regional (N1+M0), and distant (NxM1+). As expected with many malignancies, our study found and most authors in the literature agree that early stage ACC is generally found to have a better prognosis. In a multivariate analysis, Biron et al reported a multivariate hazard ratio for advanced stage ACC to be 2.02 compared to early stage ACC, which is similar to both our reported OS and CSS hazard ratios [6].
ACC tends to have a low-grade trend. Using American Joint Committee on Cancer (AJCC), Ferrell et al reported 28.7% grade I, 11.7% grade II, and 6.7% grade III/IV out of 1,509 ACC patients [5]. Interestingly, Biron et al concluded that histologic grade is a stronger predictor of survival than tumor, node, metastasis (TNM) classification. A total of 614 patients showed decreased survival in grade III and grade IV disease (multivariate analysis ratio 3.37 and 8.10, respectively) [6]. A limitation of our study is that while we also showed a low-grade trend for ACC and associated better outcomes with lower grade, the SEER database does not define a uniformed criterion for grading scale used to report grade. Grading ACC has been evolving and many improvements are being discussed in the literature. Further research should be done to determine better treatment plans, especially of intermediate grades.
The standard of care for ACC is margin-free resection whenever possible or subtotal surgical excision if not. Prior literature has reported that more patients undergo surgery only compared to surgery and adjuvant radiotherapy [5, 6, 8, 12]. This review demonstrates the same findings. Surgical techniques have been felt to improve because of emphasis on margin free resection, facial nerve preservation, and high-volume operative centers [16, 17].
There is debate regarding the role of radiation therapy with ACC. Most studies showing benefit in recurrent ACC, positive margins, and advanced T stage [6, 8, 18]. Our study showed decreased OS and CSS with patients treated with adjuvant radiation therapy, but since surgery is often effective on its own for most uncomplicated patients, adjuvant therapy is often used in patients with a poorer prognosis. As ACC has a younger age distribution, the long-term effects of radiotherapy should be kept in mind during individualized treatment plans [19, 20].
The SEER data is limited by its input; information shared is not always complete and there may be human error. One limitation of the SEER data is chemotherapy treatments, but since ACC is rarely treated with chemotherapy, this did not seem to affect our reported data. Margin status was reported, but it was very incomplete for this dataset, like some of the other variables. SEER data only shows OS or CSS, but not local control, so this data does not answer our questions in regard to radiation therapy for local control. Technology and therapeutic approaches have greatly improved over the past 40 years, but the SEER database does not contain this specific type of information. Thus, this retrospective analysis is meant to be hypothesis generating and future prospective trials will hopefully further answer these important questions. Finally, while not included within the SEER database, future analysis of molecular targets including genetic alterations would be very interesting.
Conclusions
To our knowledge, this is the largest population-based study of OS and CSS of major salivary gland ACC. We found that the patient pretreatment and treatment factors including younger age at diagnosis, female sex, early stage, lower grade, complete surgical excision with negative margins, and recent year of diagnosis are associated with improved survival in patients diagnosed with ACC of the major salivary glands. We hope that this information will aid in construction of further research projects that better refine optimal treatment protocol of individualized patient care.
Acknowledgments
We would like to acknowledge the financial support of this research project by the Community Cancer Fund, Spokane, Washington.
Financial Disclosure
This research was supported in part by the Community Cancer Fund in Spokane, WA, USA.
Conflict of Interest
None to declare.
Informed Consent
None to declare.
Author Contributions
EAK was the primary writing author, and contributed to data analysis and editing; ZCT, BJM, ZDG, JDB, RKF, and WTL were responsible for data analysis and editing; AEW and BJP contributed to biostatistics, data analysis and editing; CML was the supervising author, and contributed to data analysis and editing.
Data Availability
We certify that the available data does support the findings of this study, and data supporting the findings of this study are available within the article.
References
- 1.Godwin JT, Foote FW Jr, Frazell EL. Acinic cell adenocarcinoma of the parotid gland; report of twenty-seven cases. Am J Pathol. 1954;30(3):465–477. [PMC free article] [PubMed] [Google Scholar]
- 2.Hoffman HT, Karnell LH, Robinson RA, Pinkston JA, Menck HR. National Cancer Data Base report on cancer of the head and neck: acinic cell carcinoma. Head Neck. 1999;21(4):297–309. doi: 10.1002/(SICI)1097-0347(199907)21:4<297::AID-HED2>3.0.CO;2-R. [DOI] [PubMed] [Google Scholar]
- 3.Stewart AK, Bland KI, McGinnis LS Jr, Morrow M, Eyre HJ. Clinical highlights from the National Cancer Data Base, 2000. CA Cancer J Clin. 2000;50(3):171–183. doi: 10.3322/canjclin.50.3.171. [DOI] [PubMed] [Google Scholar]
- 4.Krane JF, Faquin WC. Cytology: diagnostic principles and clinical correlated third edition. Elsevier Inc; Salivary gland: 2009. [DOI] [Google Scholar]
- 5.Ferrell JK, Mace JC, Clayburgh D. Contemporary treatment patterns and outcomes of salivary gland carcinoma: a National Cancer Database review. Eur Arch Otorhinolaryngol. 2019;276(4):1135–1146. doi: 10.1007/s00405-019-05282-2. [DOI] [PubMed] [Google Scholar]
- 6.Biron VL, Lentsch EJ, Gerry DR, Bewley AF. Factors influencing survival in acinic cell carcinoma: a retrospective survival analysis of 2061 patients. Head Neck. 2015;37(6):870–877. doi: 10.1002/hed.23686. [DOI] [PubMed] [Google Scholar]
- 7.Barnes L, Eveson JW, Reichart P, Sidransky D. World Health Organization classification of tumours. Pathology and genetics of head and neck tumours. IARC Press; Lyon: 2005. [Google Scholar]
- 8.Al-Zaher N, Obeid A, Al-Salam S, Al-Kayyali BS. Acinic cell carcinoma of the salivary glands: a literature review. Hematol Oncol Stem Cell Ther. 2009;2(1):259–264. doi: 10.1016/S1658-3876(09)50035-0. [DOI] [PubMed] [Google Scholar]
- 9.Federspil PA, Constantinidis J, Karapantzos I, Pahl S, Markmann HU, Iro H. [Acinic cell carcinomas of the parotid gland. A retrospective analysis] HNO. 2001;49(10):825–830. doi: 10.1007/s001060170031. [DOI] [PubMed] [Google Scholar]
- 10.Betkowski A, Cyran-Rymarz A, Domka W. [Bilateral acinar cell carcinoma of the parotid gland] Otolaryngol Pol. 1998;52(1):101–104. [PubMed] [Google Scholar]
- 11.Delides A, Velegrakis G, Kontogeorgos G, Karagianni E, Nakas D, Helidonis E. Familial bilateral acinic cell carcinoma of the parotid synchronous with pituitary adenoma: case report. Head Neck. 2005;27(9):825–828. doi: 10.1002/hed.20219. [DOI] [PubMed] [Google Scholar]
- 12.Spiro RH, Huvos AG, Strong EW. Acinic cell carcinoma of salivary origin. A clinicopathologic study of 67 cases. Cancer. 1978;41(3):924–935. doi: 10.1002/1097-0142(197803)41:3<924::AID-CNCR2820410321>3.0.CO;2-L. [DOI] [PubMed] [Google Scholar]
- 13.Zbaren P, Schreiber B, Lehmann W, Widgren S. [Acinar cell carcinoma of the salivary glands] Laryngol Rhinol Otol (Stuttg) 1987;66(6):320–323. doi: 10.1055/s-2007-998664. [DOI] [PubMed] [Google Scholar]
- 14.Wahlberg P, Anderson H, Biorklund A, Moller T, Perfekt R. Carcinoma of the parotid and submandibular glands—a study of survival in 2465 patients. Oral Oncol. 2002;38(7):706–713. doi: 10.1016/S1368-8375(02)00007-6. [DOI] [PubMed] [Google Scholar]
- 15.Chiosea SI, Griffith C, Assaad A, Seethala RR. The profile of acinic cell carcinoma after recognition of mammary analog secretory carcinoma. Am J Surg Pathol. 2012;36(3):343–350. doi: 10.1097/PAS.0b013e318242a5b0. [DOI] [PubMed] [Google Scholar]
- 16.Guntinas-Lichius O, Silver CE, Thielker J, Bernal-Sprekelsen M, Bradford CR, De Bree R, Kowalski LP. et al. Management of the facial nerve in parotid cancer: preservation or resection and reconstruction. Eur Arch Otorhinolaryngol. 2018;275(11):2615–2626. doi: 10.1007/s00405-018-5154-6. [DOI] [PubMed] [Google Scholar]
- 17.Sood AJ, Houlton JJ, Nguyen SA, Gillespie MB. Facial nerve monitoring during parotidectomy: a systematic review and meta-analysis. Otolaryngol Head Neck Surg. 2015;152(4):631–637. doi: 10.1177/0194599814568779. [DOI] [PubMed] [Google Scholar]
- 18.Laramore GE. Fast neutron radiotherapy for inoperable salivary gland tumors: is it the treatment of choice? Int J Radiat Oncol Biol Phys. 1987;13(9):1421–1423. doi: 10.1016/0360-3016(87)90240-9. [DOI] [PubMed] [Google Scholar]
- 19.Thomson DJ, Slevin NJ, Mendenhall WM. Indications for salivary gland radiotherapy. Adv Otorhinolaryngol. 2016;78:141–147. doi: 10.1159/000442134. [DOI] [PubMed] [Google Scholar]
- 20.Hosni A, Huang SH, Goldstein D, Xu W, Chan B, Hansen A, Weinreb I. et al. Outcomes and prognostic factors for major salivary gland carcinoma following postoperative radiotherapy. Oral Oncol. 2016;54:75–80. doi: 10.1016/j.oraloncology.2015.11.023. [DOI] [PubMed] [Google Scholar]
Associated Data
This section collects any data citations, data availability statements, or supplementary materials included in this article.
Data Availability Statement
We certify that the available data does support the findings of this study, and data supporting the findings of this study are available within the article.