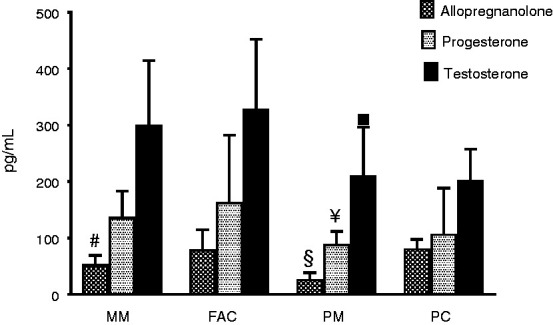
Figure 1.

Serum levels (mean ± SD) of allopregnanolone, progesterone and testosterone in fertile age (MM and FAC groups) and postmenopausal (PM and PC groups) women.
#p < 0.001 vs. FAC group; §p < 0.001 vs. PC and MM groups; ¥p = 0.027 vs. MM group; ▪p < 0.001 vs. MM group, one-way analysis of variance followed by the Tukey-Kramer post-hoc comparison test.
