. 2020 Oct 12;9:e59699. doi: 10.7554/eLife.59699

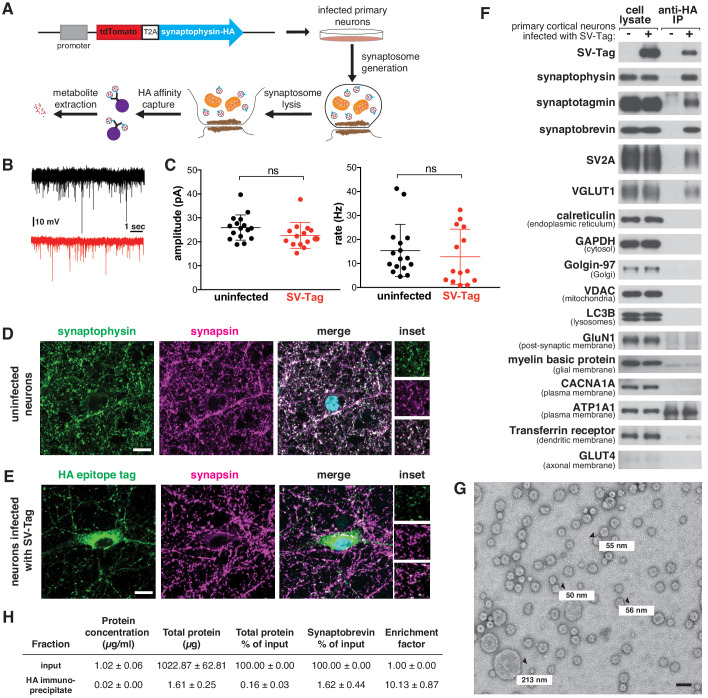
Figure 1. A method for rapid and specific isolation of synaptic vesicles (SVs) from mouse primary cortical cultures.

(A) Construct design for tagging SVs and schematic of the workflow used to isolate SVs. (B) Representative traces of mEPSCs in uninfected neurons (black) and neurons infected with SV-tag (red). (C) Summary of the average amplitude (± standard deviation (std) and rate of mEPSCs in uninfected neurons and neurons infected with SV-tag (Vhold = −70 mV, 1 µM TTX, 10 µM gabazine)). Non-significant p-value = n.s. (D) Immunostaining of uninfected primary neurons for endogenous synaptophysin (green) and synapsin (magenta). Cyan in the merged image represents DAPI-stained nuclei. Insets show selected fields that were magnified 1.6X. Scale bars: 10 µm. (E) Immunostaining of infected primary neurons expressing SV-tag (green) and synapsin (magenta) in. Insets show selected fields that were magnified 1.6X. Scale bars: 10 µm. (F) Immunoblot analysis of protein markers for SVs and indicated subcellular compartments and membranes in whole-cell lysates, purified SVs, and control immunoprecipitates. Lysates were prepared from neurons infected with lentivirus encoding SV-tag. 0.4% of the lysate and 5% of the immunoprecipitates were loaded into the indicated lane. (G) Electron microscope image of vesicles isolated with the workflow. Values denote diameter of indicated particles, specified by black arrows. Scale bar: 100 nm (H) Table summarizing the relative enrichment of synaptobrevin in the final immunoisolate from SV-tagged neurons, as assessed by quantitative immunoblotting. Values represent the mean ± std of three biological replicates. Source data is included (Figure 1—source data 1).

Figure 1—source data 1. Quantification of total protein and synaptobrevin content in input and HA immunoisolates from the SV-tag workflow.
Figure 1—source data 2. Analysis of particle size distribution in EM images of the final immunoisolate from SV-tagged neurons.

Figure 1.

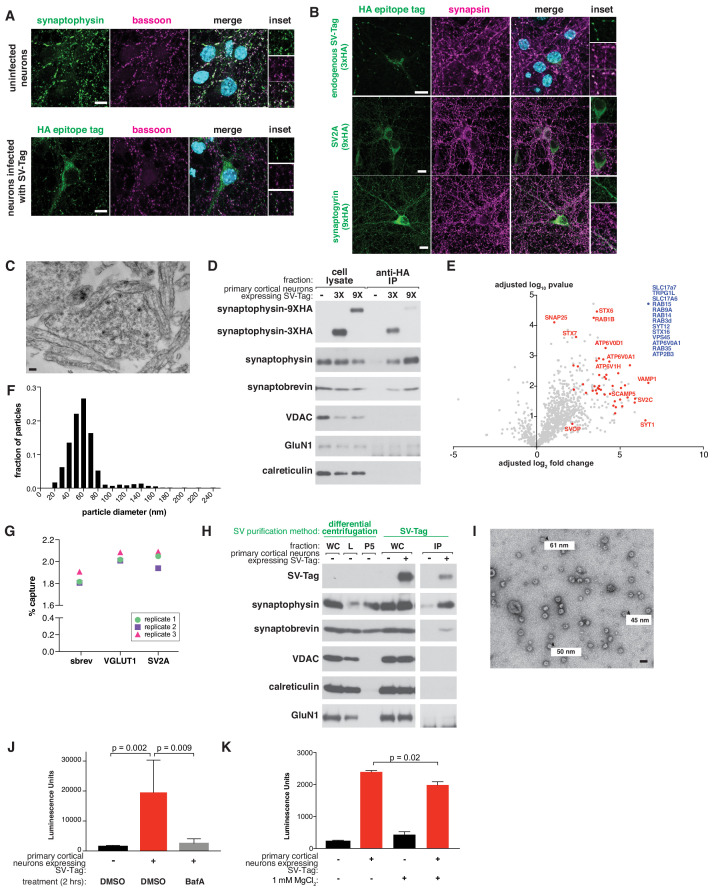
Figure 1—figure supplement 1. Characterization of synaptic vesicles isolated from mouse primary cortical cultures.

Figure 1—figure supplement 1.

(A) Immunostaining of bassoon (magenta) in uninfected primary neurons (top panel) and neurons expressing SV-tag (green) (bottom panel). Cyan in merged image represents DAPI-stained nuclei. Insets show selected fields that were magnified 1.5X. Scale bars: 10 µm. (B) Immunostaining of primary neurons expressing indicated HA-tagged proteins (green) and endogenous synapsin (magenta). Specifically, neurons are expressing endogenously tagged synaptophysin with a triple HA-tag (top row), SV2A tagged at the N-terminus with nine tandem HA-tags (9x HA) (middle row), and synaptogyrin tagged at the N-terminus with a 9X HA-tag (bottom row). Insets show selected fields that were magnified 1.7X (top row) and 1.35X (middle and bottom row). Scale bars, 10 µm. (C) Electron microscope image of synaptosomes generated with the workflow. Scale bar, 100 nm. (D) Immunoblot analysis of the effect of the number of HA-tags on the efficiency of SV isolation. Lysates were prepared from neurons infected with lentivirus encoding for synaptophysin conjugated to three HA-tags (3X) or nine HA-tags (9X). (E) Proteomics analysis of isolated SVs vs. control IP. The blue dot denotes proteins in which there were no detected peptides in the control IP (n = 70, 14 of which are validated SV proteins), and red dots represent established SV proteins based on literature. (F) Histogram of the distribution of particle diameters observed by EM imaging of the final immunoisolate from SV-tagged neurons (source data included in Figure 1—source data 2) (G) Percent of initial input of synaptobrevin (sbrev), VGLUT1, and SV2A proteins present in the immunoisolate from SV-tagged neurons (H) Immunoblot analysis of SVs isolated with the SV-tag based workflow compared to a previously established one based on differential centrifugation. WC: whole cell, L: whole-cell lysate, P5: SV pellet, IP: HA immunoprecipitate (I) Electron microscope image of SVs generated with the differential centrifugation method used in S1H. Values denote diameter of indicated particles. Scale bar, 100 nm (J) Luminescence-based detection of glutamate in SVs isolated from neurons treated with DMSO or Bafilomycin A (500 nM) 2 hr prior to isolation. (K) Luminescence-based detection of glutamate in SVs isolated in the absence or presence of 1 mM MgCl2.