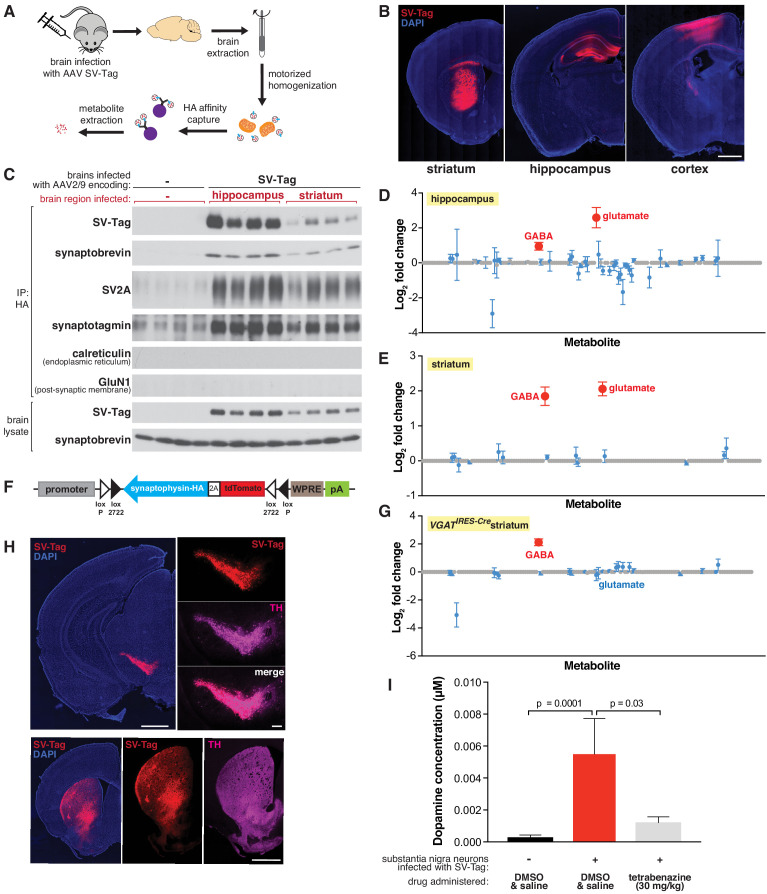
Figure 4. Adaptation of the workflow for rapid and specific isolation and metabolite profiling of synaptic vesicles (SVs) directly from mouse brain tissue.
(A) Schematic of the workflow used to isolate SVs from mouse brain tissue. (B) Immunofluorescence images of coronal sections from wild-type mouse brains transduced with SV-tag in the indicated brain regions. Neurons are labeled with DAPI nuclear stain (blue) and SV-tag (red). Scale bar: 1 mm. (C) Immunoblot analysis of indicated protein markers present in brain lysates, control immunoprecipitates from uninfected brains, and HA immunoprecipitates from hippocampi and striatum that were infected with SV-tag. (D) LC/MS profile of SVs isolated from wild-type mice brains infected with SV-tag in hippocampus compared to a control IP from uninfected brains. (mean ± SEM, n = 4). Color code and legend is the same as in Figure 2C. (E) LC/MS profile of SVs isolated from wild-type mice brains infected with SV-tag in striatum compared to uninfected brains. (mean ± SEM, n = 4) (F) Construct design for expression of SV-tag in neurons in a Cre-dependent manner. (G) LC/MS profile of SVs isolated from Slc32a1IRES-Cre/wt (VGATIRES-Cre) mice brains infected with SV-tag in striatum compared to uninfected brains. (mean ± SEM, n = 4) (H) Coronal sections from a Slc6a3IRES-Cre/wt mouse transduced with Cre-dependent SV-tag in dopaminergic neurons of the midbrain. Dopamine neurons are immunolabelled for tyrosine hydroxylase (TH, magenta), DAPI nuclear stain (blue) and SV-tag (red). (I) Targeted LC/MS profiling of dopamine in SVs isolated from Slc6a3IRES-Cre/wt mice transduced with Cre-dependent SV-tag in dopaminergic neurons of the midbrain. Indicated mice were subjected to saline injection or tetrabenazine injection intraperitoneally 2 hr prior to harvesting of SVs.


