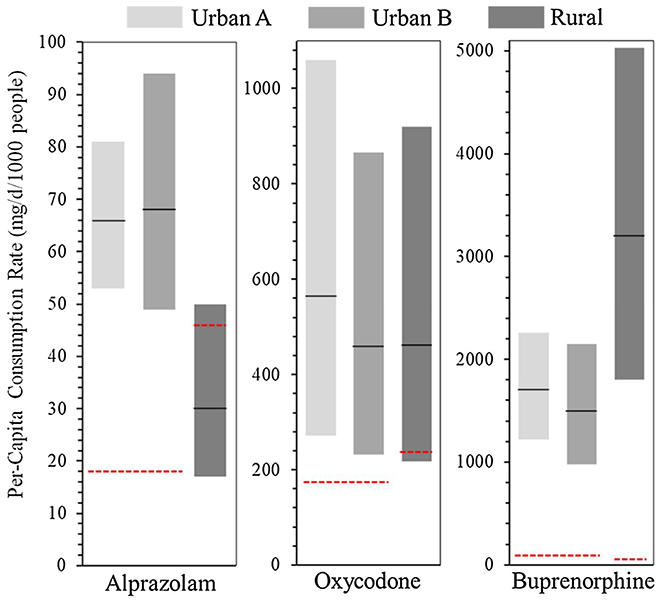
Fig. 3.

Comparison between the KASPER’s conventional estimation and the WBE estimation of select substances of potential abuse. The bars represent a 95% confidence interval of the WBE-derived mean consumption rate while KASPER’s estimates are marked as red dotted lines. (For interpretation of the references to colour in this figure legend, the reader is referred to the web version of this article).
