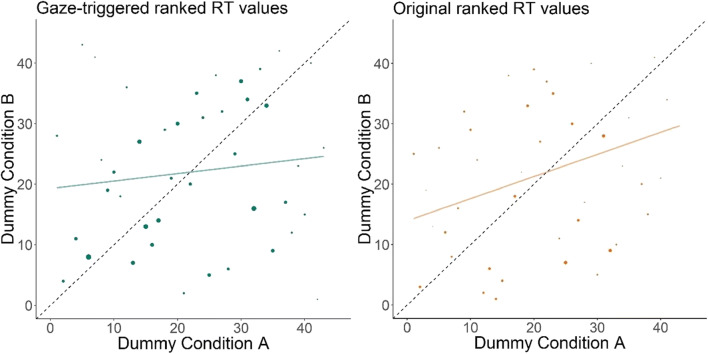
Fig. 5.
Scatterplot of dummy conditions created by subsetting reaction times (RTs) within participant within the Gaze-triggered (left) and the Original (right) condition. The size of the dots reflects the number of trials that were used for computing the mean reaction time per participant (range: 4–25 in the Gaze-triggered, 2–15 in the Original condition). The dashed lines indicate what the ideal distribution of the data would be and the colored lines represent the best fit to the data

