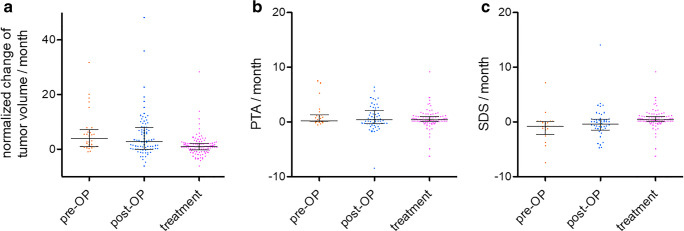
Fig. 1.
Box-plots showing change of tumor volume (a), changes of pure-tone average (PTA) (b), and of speech discrimination score (SDS) (c) between two measurement points in the treatment and the non-treatment periods, as well as in the period before surgery. For each parameter, the data sets in the three periods did not differ significantly from each other but a trend of slower growth and change of SDS in treatment periods was seen. Preop, preoperative; Postop, postoperative. This data was illustrated and published in the original work of Gugel et al. [26]

