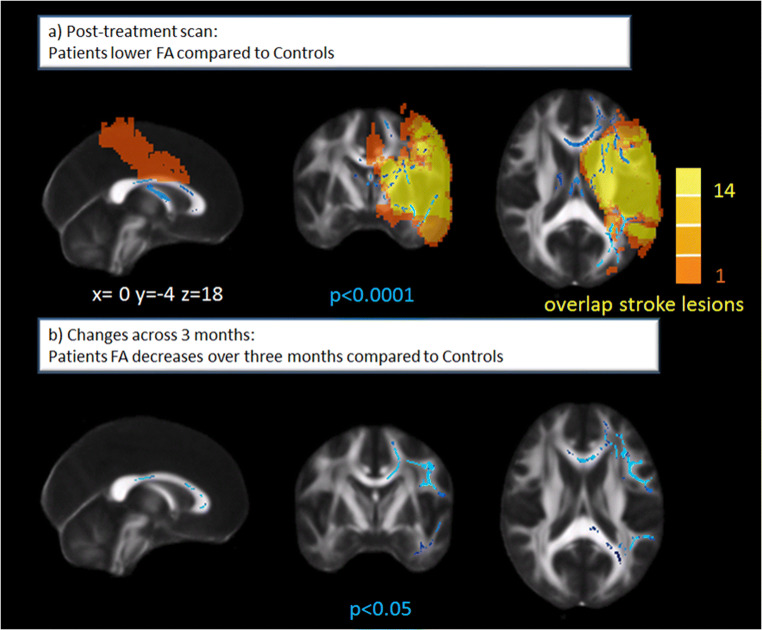
Fig. 2.
a Lower white matter integrity in stroke patients compared with controls at post-treatment scan (24–72 h after symptom onset) shown in blue. Note that even in this homogeneous sample, there is substantial variability in the extent of the ischemic lesions ranging from 1 to 14 overlapping lesions presented in orange-yellow. FA, fractional anisotropy. b Significant decreases in white matter integrity (assessed by FA) in patients compared with controls over 3 months post-stroke

