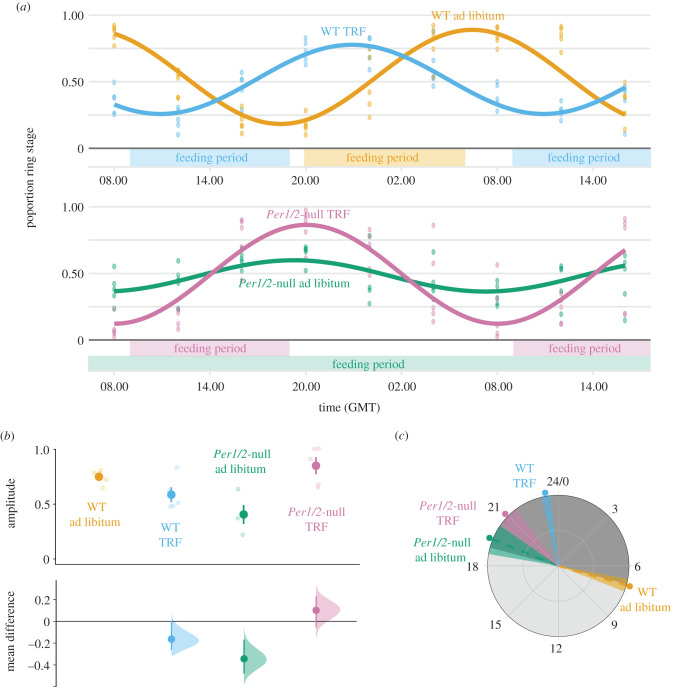
Figure 2.
The IDC of desynchronized parasites becomes coordinated to host feeding-associated rhythms. Population cosinor model fits and data points from each individual infection (Day 5–6 PI) (a). Amplitude (b) and phase in hours (GMT) (c) were calculated from cosinor model fits from each individual mouse (lighter points) and then summarized as a mean ± s.e.m., points with error bars in (b), and circular mean ± s.d. point with dashed line and shading in (c). For amplitude (b), effect sizes relative to the ‘WT ad libitum’ group are plotted on the lower axes as a bootstrap sampling distribution (mean difference ± 95% CI depicted as a point with error bars). For all parts, infections in WT hosts are coloured orange and blue, and infections in Per1/2-null mice are coloured green and purple (n = 5 for the WT and TRF groups, n = 4 for Per1/2-null ad libitum group). TRF indicates ‘time-restricted feeding’ with food only available for 10 h each day (feeding period indicated above x axis in (a)). Grey shading in (c) represents active (dark shading; 19.00–07.00) and rest (light shading; 07.00–19.00) periods relative to WT mice in DD. (Online version in colour.)

