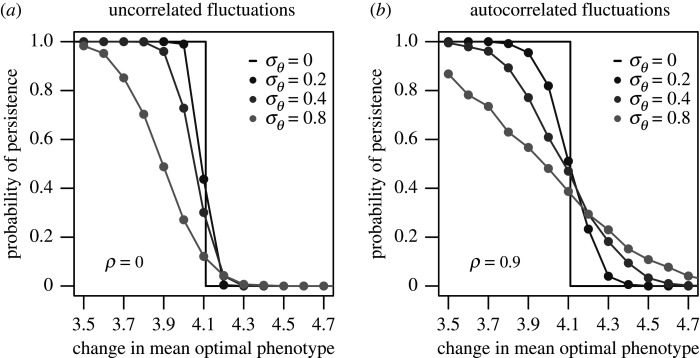
Figure 2.
The probability of persistence in the population-level polygenic model for different magnitudes of environmental change μθ. Each point represents the proportion of 1000 runs of the simulation in which the population persisted until the end of the simulation (Nt > Nc for all t). Lighter shades of grey indicate greater degrees of variation in the optimal phenotype (σθ). (a) shows results for uncorrelated (ρ = 0) fluctuations in the optimal phenotype and (b) shows results for autocorrelated (ρ = 0.9) fluctuations in the optimal phenotype. Other parameter values were μF = 1.2, N* = 10 000, Nc = 100, ω2 = 10, p = 1, G = 0.5. (Estimated values have a binomial distribution, which using 1000 runs have a maximum standard deviation of 0.016 around the true value.)

