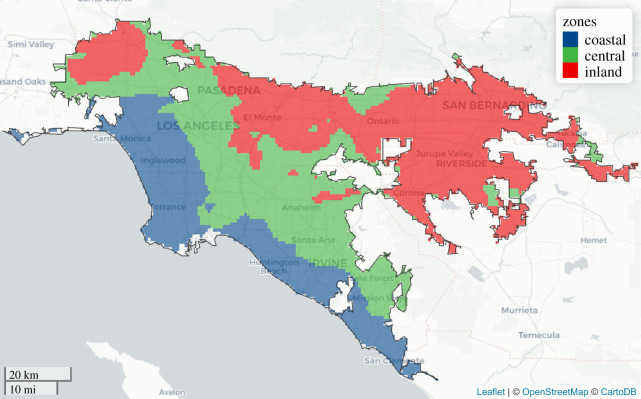
Figure 1.
Delineation of three climate zones in metropolitan Los Angeles determined by clustering (k-means) of average June–October daily mean temperatures over the study period (2006–2016): coastal zone (19.6–22.0°C; blue), central zone (greater than 22.0–23.3°C; green) and inland zone (greater than 23.3–25.4°C; red). The black outline identifies the boundary of metropolitan Los Angeles. (Online version in colour.)

