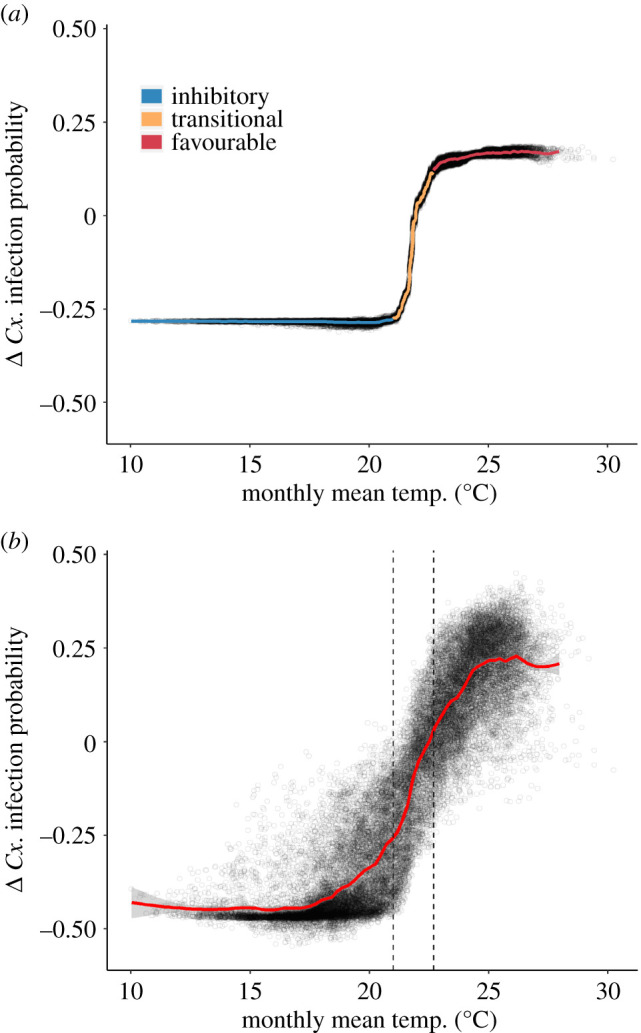
Figure 2.

Marginal effects plots showing the marginal change in the predicted probability of WNV presence in Cx. quinquefasciatus pools (Cx. infection probability) associated with: (a) monthly mean temperature (with a one-month lag); and (b) all temperature predictors in the random forest model (measured at daily, weekly, monthly and quarterly aggregations/lags). Line colour in (a) shows inhibitory (blue), transitional (orange) and favourable (red) temperature ranges. Vertical dashed lines in (b) highlight the transitional range derived from (a). Points in (a) and (b) represent all observations over the study period. The smoothed marginal effects curves were generated with a generalized additive model. (Online version in colour.)
