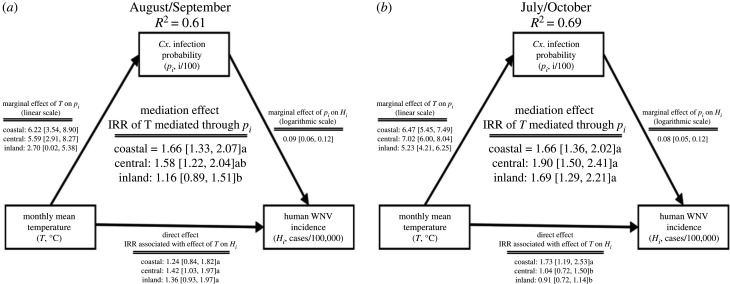
Figure 4.
Schematic of the mediation model showing the direct effects of average monthly mean temperature on monthly human WNV incidence and the indirect effects mediated by the average monthly Cx. infection probability during (a) August and September and (b) July and October in each metropolitan LA zone. Mediation and direct effect coefficients are incidence rate ratios (IRR), representing the relative increase in incidence attributed to a 1°C increase in monthly mean temperature. Brackets contain 95% confidence intervals and letters show statistically significant differences in mediation and direct effects among metropolitan L.A. zones (p < 0.05). Diagram adapted from publicly available R code [41].

