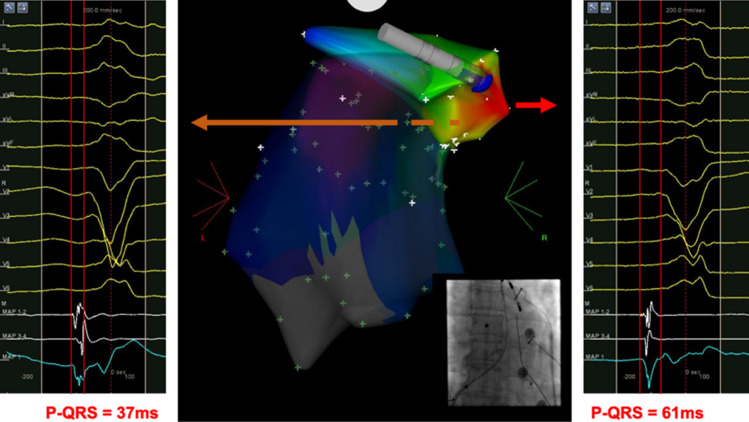
Figure 5.
An example of successful ablation in the PSC. In the left panel, the local electrogram of the site with earliest activation time below the PV is presented. In the middle: the CARTO activation map of a PVC in the posterior–anterior view is shown, while fluoroscopic view in the anterior–posterior view is also presented in the bottom right corner. The blue dot points to the site where ablation led to the elimination of PVCs. The local electrogram of the site with earliest activation time during PSC mapping is presented in the right panel.

