Figure 1.
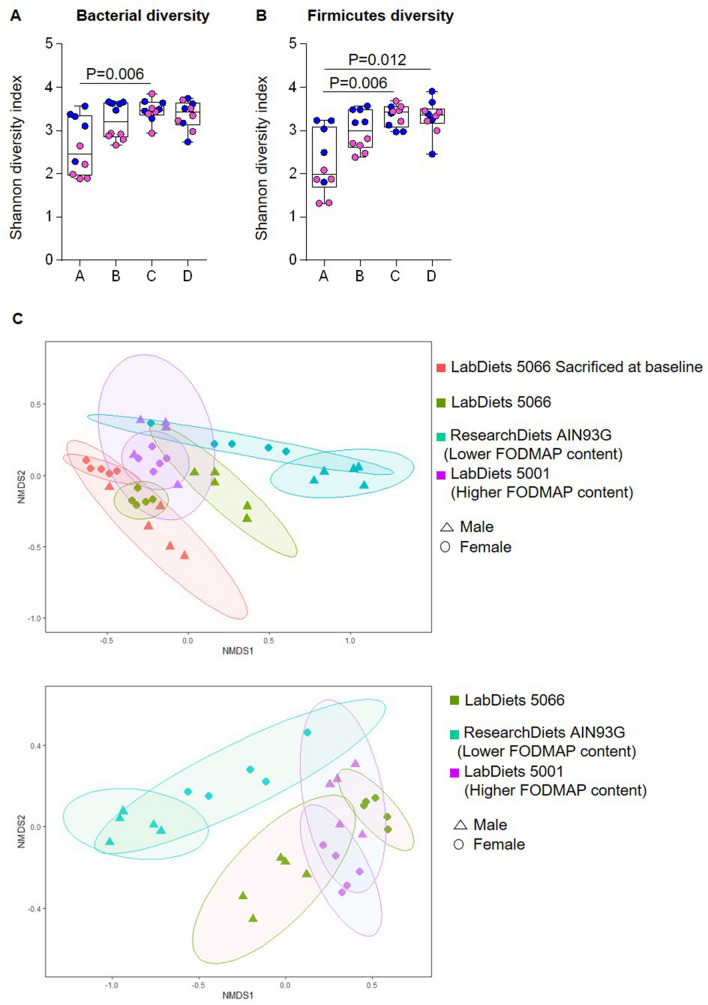
Analysis of cecal microbiota of mice receiving 4 different commercially available rodent diets. (A) α-diversity plot of the Shannon diversity index. Females are shown here as pink dots and males as blue dots. Sex significantly influenced microbial diversity in group A and B, both groups receiving the LabDiet 5066. The analysis was done with the script “compare_alpha_diversity.py” with the option of non-parametric testing, and p value was determined with Monte Carlo permutations. Multiple comparisons were corrected with Bonferroni correction. (B) Shannon diversity index plot of Firmicutes diversity. Firmicutes diversity was altered by diet C and D in comparison to diet A (p = 0.006, and p = 0.006, respectively). The analysis was done with the script “compare_alpha_diversity.py” with the option of non-parametric testing, and p value was determined with Monte Carlo permutations. Multiple comparisons were corrected with Bonferroni correction. (C) β-diversity plot (NMDS) constructed using the Bray–Curtis dissimilarity matrix. Cecal microbiota profiles were significantly altered by the use of different diets. Mice clustered by type of diet and sex (Adonis p < 0.01).

