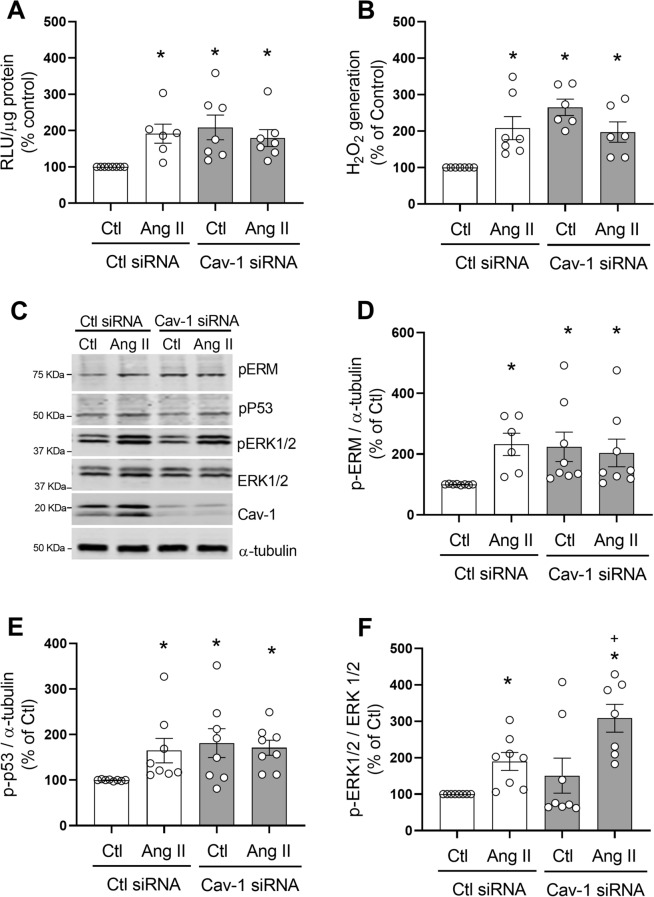
Figure 10.
Cav-1 silencing increases ROS production and redox signaling in hVSMC. Cells were transfected with Cav-1 or control (Ctl) siRNA and stimulated with Ang II (100 nmol/L) for 5 min. NADPH-derived O2− generation measured by lucigenin assay (A). H2O2 levels were measured by the Amplex Red assay (B). Representaive images of phospho-Ezrin–Radixin–Moesin, phospho-p53, phospho-ERK1/2 and Cav-1 detected by western blot. α-tubulin and total ERK1/2 were used as loading control (C). Protein quantification of Ezrin–Radixin–Moesin (D), p53 (E) and ERK1/2 (F) phosphorylation in hVSMCs. Data are means ± SEM from 6–8 experiments. Control was taken as 100% and data are presented as the percentage changes relative to control conditions. *P < 0.05 vs. control, +P < 0.05 vs. AngII Ctl siRNA. Cav-1 caveolin-1, Ang II angiotensin II, Ctl control, H2O2 hydrogen peroxide, RLU relative light units, p-MLC20 phosphorylated MLC20, p-ERM phosphorylated Ezrin–Radixin–Moesin, p-p53 phosphorylated p53, p-ERK1/2 phosphorylated ERK1/2.

