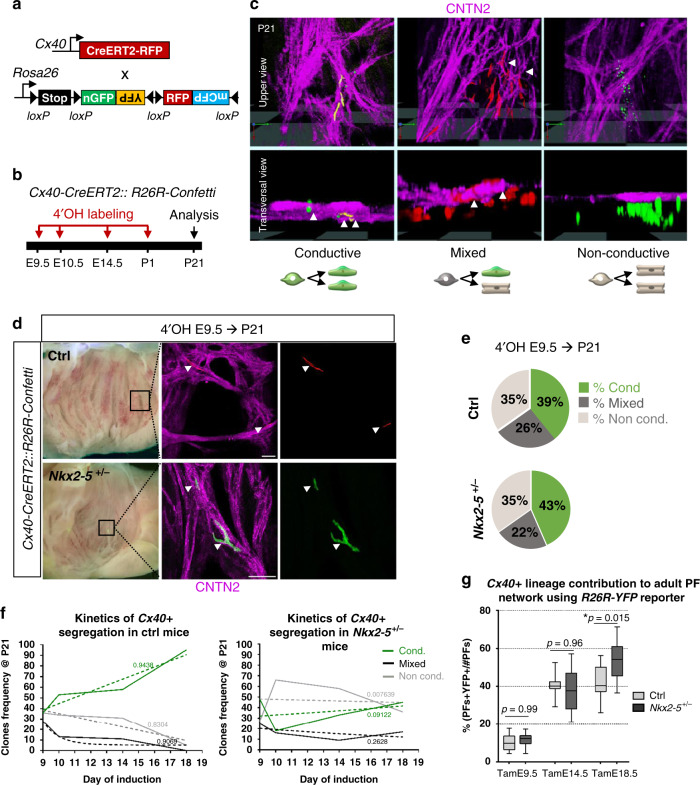
Fig. 2. Temporal clonal analysis of single Cx40+ trabecular cells during embryonic stages.
a Scheme of the strategy used for clonal genetic tracing of Cx40+ cells. R26R-Confetti multicolor reporter mice are crossed with tamoxifen-inducible Cx40-CreERT2 mice. Four alternative recombination (nGFP, YFP, RFP, and mCFP) are possible. b Low doses of 4-hydroxytamoxifen (4’OH-Tam) are injected at different time points of development to induce low-frequency recombination. Analyses of independent unicolor clones are made at P21. c 3D reconstructions of clones imaged at the subendocardial surface of the left ventricle. Whole-mount immunostaining for Contactin-2 (CNTN2) is used to distinguish conductive, mixed and non-conductive clones. Arrowheads indicate cells positive for CNTN2. Schemes illustrate the lineage origin of each clone. d Confocal images of whole-mount CNTN2-immunostaining of 3-week-old Cx40-CreERT2::R26R-Confetti opened-left ventricle induced at E9.5 from control (Ctrl) and Nkx2-5+/− hearts. Conductive clones are indicated by arrowheads. Scale bars = 100 µm. e Percentages of conductive, mixed and non conductive clones induced at E9.5 were quantified in P21 control (Ctrl) and Nkx2-5+/− left ventricles. f Clone frequency evolution upon time-course inductions quantified in P21 control (Ctrl) and Nkx2-5+/− mice. The progressive decrease of mixed clones over time illustrates the kinetics of Cx40+ trabecular progenitors segregation. Dashed lines: non-linear regression curves with R square values. g Graphs of the percentage of labeled adult PFs according to Cx40+ lineage traced by Tam injections at E9.5, E14.5, or E18.5. Box plots show the median, the 25th and 75th percentile, and the whiskers denote the minimum and maximum values, respectively. Quantifications were performed on Cx40-CreERT2::R26R-YFP control (ctrl) or Nkx2-5+/− heart transverse sections. Mean of 3 sections/heart (Tam E14.5; Tam E18.5); 4 sections/heart (TamE9.5); (n = 3 TamE9.5 Ctrl, TamE18.5 Ctrl and Nkx2-5+/−; n = 4 TamE9.5 Nkx2-5+/−, TamE14.5 Ctrl and Nkx2-5+/−). P values are derived ordinary one-way ANOVA test (Tukey test), *P < 0.05.

