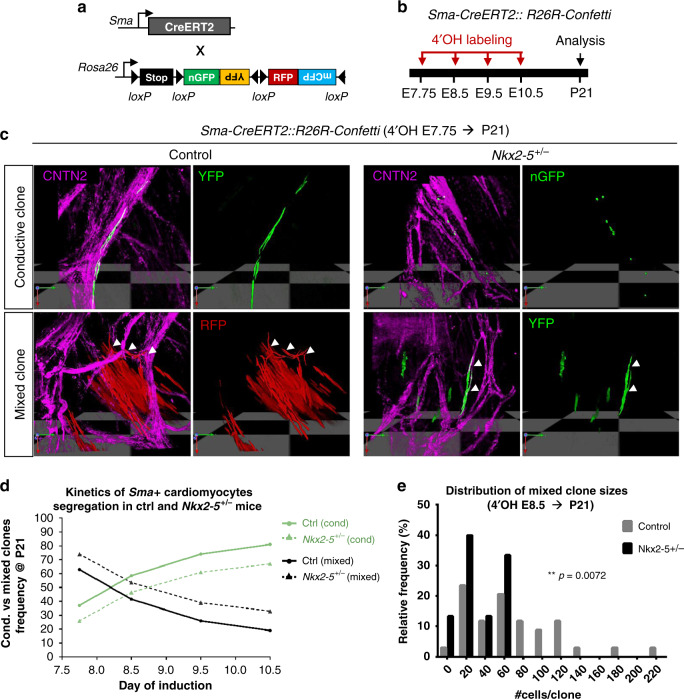
Fig. 3. Temporal clonal analysis of single Sma+ cardiomyocytes during embryonic stages.
a Scheme illustrating the genetic clonal tracing strategy using R26R-Confetti multicolor reporter mouse line crossed with tamoxifen-inducible Sma-CreERT2 mice. b Time course of 4-hydroxytamoxifen (4’OH-Tam) injections and analyses of independent unicolor clones represented on a time scale. Low doses of 4′OH induce low-frequency recombination. c 3D reconstructions of conductive and mixed clones induced at E7.75 and observed within Sma-CreERT2::R26R-Confetti opened-left ventricles at P21 of control (Ctrl) and Nkx2-5+/− left ventricle. Whole-mount immunostaining for Contactin-2 (CNTN2) is used to distinguish conductive cells (CNTN2+) as indicate by arrowheads. d Conductive versus mixed clones frequency evolution upon time-course inductions quantified in P21 control (Ctrl) and Nkx2-5+/− left ventricle. The progressive decrease of mixed clones frequency over time illustrates the kinetics of Sma+ cardiac progenitors segregation. e Diagram of the relative frequency of mixed clone sizes induced at E8.5 in P21 control and Nkx2-5+/− left ventricles. P value is derived from non-parametric Mann–Whitney t-test, **p < 0.01.

