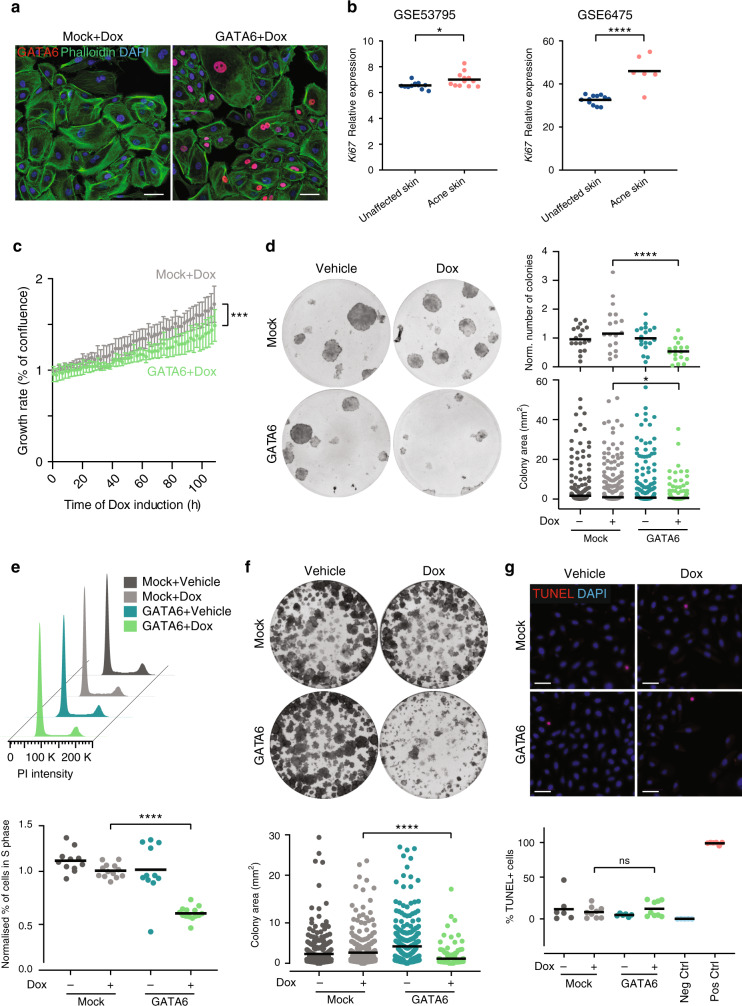
Fig. 3. Effects of GATA6 on proliferation, colony formation, and apoptosis.
a Representative immunofluorescence images of Mock and GATA6-infected IFE keratinocytes labelled with antiGATA6 and phalloidin. Cells were treated with 1 μg ml−1 doxycycline (Dox) for 16 h. b Expression of Ki67 transcripts (average of probes 212020_s_at, 212021_s_at, 212022_s_at, and 212023_s_at) in unaffected skin and acne lesions from microarray datasets GSE53795 (n = 12 control skin, n = 12 acne skin; p = 0.016) and GSE6475 (n = 12 control skin, n = 6 acne skin; p = 0.00002). c Proliferation of ORS keratinocytes assessed as % confluence using an Incucyte video-microscope. Values at each time point were normalised to the first scan point of the Mock+Dox condition (n = 4/condition; p = 0.0001). d Number of colonies (normalised to the number of colonies in the corresponding Vehicle condition) and colony area of ORS keratinocytes overexpressing GATA6 (n = 18/condition; p < 0.0001 and p = 0.037, respectively). Representative dishes are shown. e Mock-infected or GATA6-infected sebocytes were treated with 1 μg ml−1 Dox for 4 days. Representative histograms of propidium iodide (PI)-stained cells and quantification of % S phase cells compared to the Mock+Dox condition are shown (n = 13 for Mock conditions, n = 11 for GATA6 + Vehicle, n = 14 for GATA6+Dox; p < 0.000001). f Colony area of Mock or GATA6 SebE6E7 in the presence of 1 μg ml−1 Dox (n = 6/condition; p = 0.00004). Representative dishes are shown. g Mock or GATA6 infected sebocytes treated with 1 μg ml−1 Dox or vehicle for 4 days (n = 6 for Vehicle conditions, n = 9 for Dox conditions; p = 0.799). Representative images of TUNEL-stained cells and quantification of the percentage of TUNEL+ cells are shown. Negative (Neg Ctrl, n = 5) and positive (Pos Ctrl, n = 6) controls are shown. a, g Nuclei were counterstained with DAPI. Scale bars: 50 μm. a–g Data are presented as mean ± SD (c) or individual values with means (b, d–g) and were obtained from two (a, f), three (d, g), four (c), or five (e) independent experiments corresponding to n replicates. Statistical analyses were performed with two-tailed unpaired t-test (b), linear regression (c) or with ordinary one-way ANOVA (d–g). ns not significant; *p-value < 0.05; ***p-value < 0.0005; ****p-value < 0.00005. b–g Source data are provided as a Source Data file.

