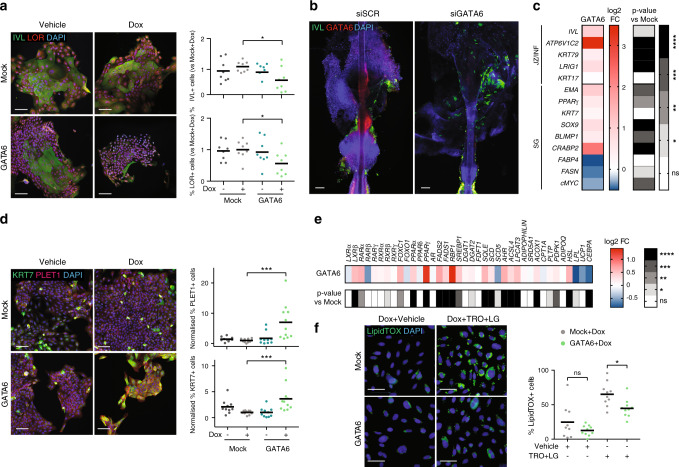
Fig. 4. GATA6 regulation of ductal and sebaceous differentiation.
a Mock or GATA6-infected keratinocytes treated with 1 μg ml−1 Dox for 5 days and immunolabelled for IVL and LOR (n = 8/condition; p = 0.011 and p = 0.021 respectively). Representative images and quantitation are shown. b Organ-cultured human HF transfected with siSCR or siGATA6 and maintained for 5 days. Representative images for GATA6 and IVL staining. c–f Mock or GATA6-infected SebE6E7 sebocytes treated with 1 μg ml−1 Dox or vehicle for 4 (c, e) or 5 (d) days; 1 μg ml−1 Dox and vehicle (DMSO) or 1 μM TRO + 0.1 μM LG for 4 days (f). c, e Gene expression in GATA6+Dox sebocytes is represented as log2 FC versus Mock+Dox sebocytes (n = 6/condition in c, and n = 20/condition in e). d Representative images of PLET1 and KRT7 labelling and quantification are shown (n = 10 for Vehicle conditions and n = 11 for Dox conditions; p = 0.0001 and p = 0.0002, respectively). f Representative images of LipidTOX staining and quantification are shown (n = 9 for Mock+Dox+Vehicle and n = 10 for other conditions). a–f Scale bars: 50 μm (f), 100 μm (a, b, d). Nuclei were counterstained with DAPI (a, b, d, f). Data are represented as mean (c, e) or mean with individual values (a, d, f) and were obtained from two (b, c), three (a, d, f), or five (e) independent experiments corresponding to n replicates. Statistical analyses were performed with ordinary one-way ANOVA (a, c, d, f) or two-tailed multiple t-tests (e). ns not significant; *p-value < 0.05; **p-value < 0.005; ***p-value < 0.0005; ****p-value < 0.00005. a, c–f Source data are provided as a Source Data file.

